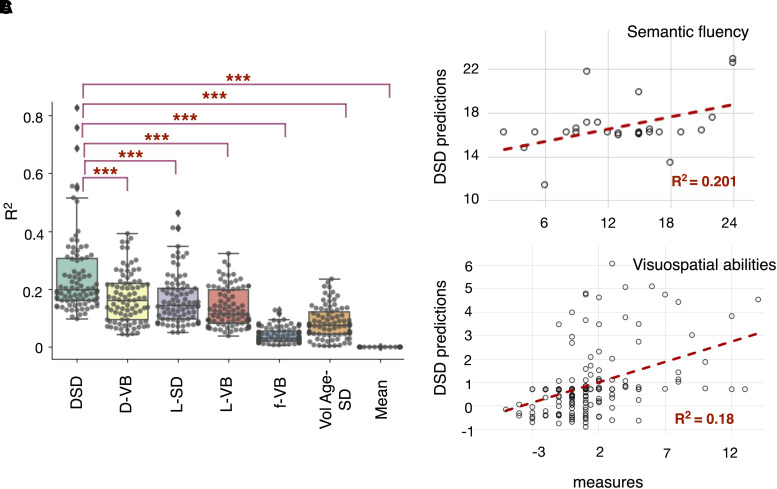
Figure 7.
DSD R2 and comparison with other predictive models. (A) The box plot reports all the R2 across the neuropsychological scores (dataset 2) by regressing measured and predicted scores as obtained from the DSD compared with six other models: the disconnectome voxel-based (VB) correlations (D-VB), the symptom discoverer (SD) UMAP embedding of the lesion data (L-SD), the lesion VB mapping (L-VB), the functional dysconnectivity VB (f-VB), the SD with variables lesion volume and age (VolAge-SD) and the mean of the group. The box shows the quartiles, and the whiskers extend to the rest of the distribution, excluding the interquartile range outliers. Inside the boxes, the line indicates the median R2: R2 = 0.20 for the DSD, R2 = 0.16 for the D-VB, R2 = 0.14 for the L-SD, R2 = 0.11 for L-VB, R2 = 0.03 for f-VB, R2 = 0.07 for lesion size and age as predictors and R2 = 0 for the group mean. The asterisks correspond to the P-value obtained from a paired t-test (2-tails, Bonferroni corrected for multiple comparisons): ***P < 0.001. (B) DSD out-of-sample predictions for the semantic fluency test, animal category, n = 26 stroke patients (dataset 3). (C) DSD replication and out-of-sample predictions for visuospatial abilities, Bell’s score, n = 193 stroke patients (dataset 5).

