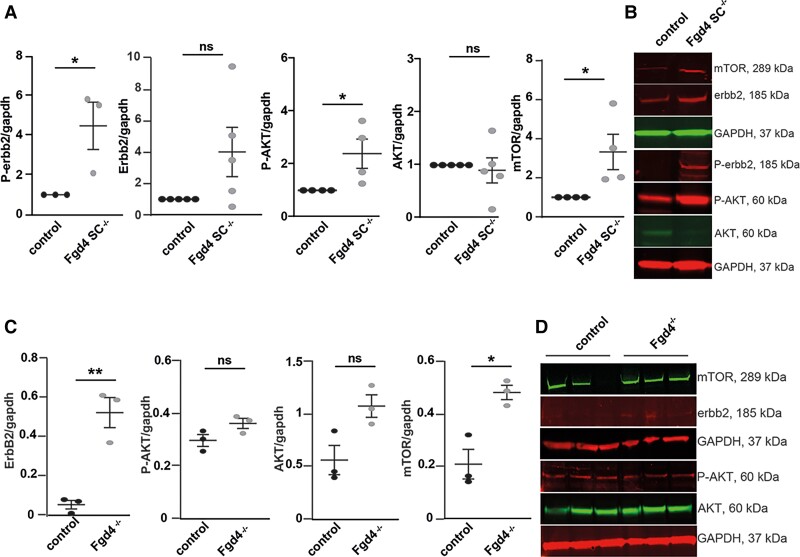
Figure 2.
Neuregulin-1 type III/ERBB2/3/AKT/mTOR pathway is upregulated in CMT4H models. (A and B) Phosphorylated ERBB2 (P-ERBB2) and AKT (P-AKT) as well as mTOR expression are significantly increased in Fgd4SC–/– co-cultures compared to control. (A) Levels of expression of P-ERBB2, ERBB2, P-AKT, AKT and mTOR were assessed by western blot analysis. Data are expressed as mean ± SEM (n = 3–4 co-cultures) and normalized to the control values. Statistical analysis: unpaired Student’s t-test. (B) Western blot pictures illustrating the expression of the markers described in A. (C and D) Levels of expression of P-ERBB2, ERBB2, P-AKT, AKT and mTOR were assessed by western blot analysis in the sciatic nerves of Fgd4–/– mice compared to WT mice. (C) Data are expressed as mean ± SEM (n = 3 animals per genotype). Statistical analysis: unpaired Student’s t-test. (D) Western blot pictures illustrating the expression of the markers described in C. *P < 0.05, **P < 0.01, ***P < 0.001.

