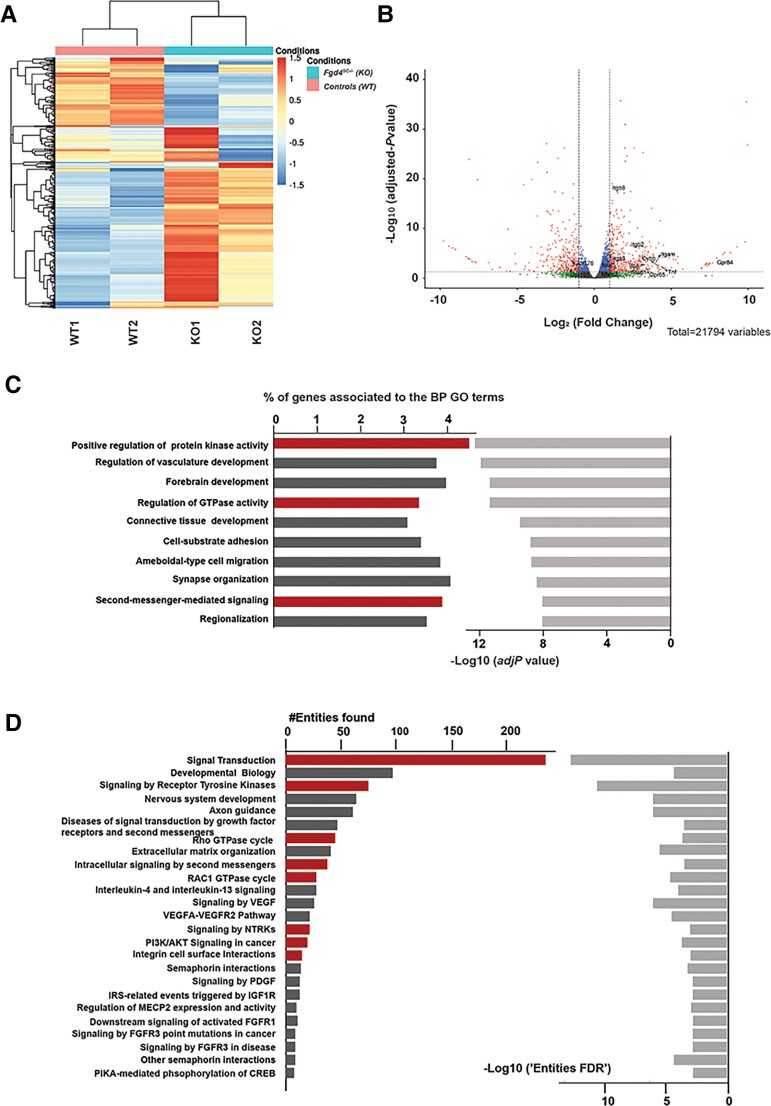
Figure 3.
Transcriptional profiles of in vitro myelin samples (DRG/SC co-cultures) from conditional knockout (Fgd4SC–/–) and control (WT) mice. (A) Full heat map of unsupervised hierarchical clustering of the four samples (n = 2 replicates for Fgd4SC–/– and 2 replicates for WT). The scale bar unit is obtained applying a variance stabilizing transformation to the count data (DESeq2: VarianceStabilizingTransformation) before normalization. (B) Volcano plots showing the distribution of gene expression fold changes and adjusted P-values between the two conditions. A total number of 21 794 genes were tested. Padj < 0.05 was used as the threshold to reject the null hypothesis and consider the difference in gene expression. Red plots represent significantly deregulated genes [adjusted P-value < 0.05, with fold change (FC) > 2 or <−2]. Genes with significant deregulation (adjusted P-value < 0.05) but with small FC (−2 < FC < 2) are indicated in blue. Green and grey dots represent genes with non-significant fold changes (adjusted P > 0.05). (C) Top 10 BP GO terms enriched in the DEGs. We identified BPs with an adjusted P-value lower than 0.05. The bars on the left represent the percentage of DEGs determined for each represented GO term from the total number of DEGs. Light grey bars on the right represent the enrichment score (–Log10 of adjusted P-value) for each GO term. GO terms with particularly interesting functions, regarding the NRG1 type III pathway and FRABIN, are highlighted in red. (D) Top 25 reactome pathways enriched for the 536 genes found in the top 10 significantly enriched GO terms from C (adj. P-value < 0.001). The bars represent the number of DEGs found in each reactome pathway. Pathways with particularly interesting functions regarding the NRG1 type III pathway and FRABIN are highlighted in red.

