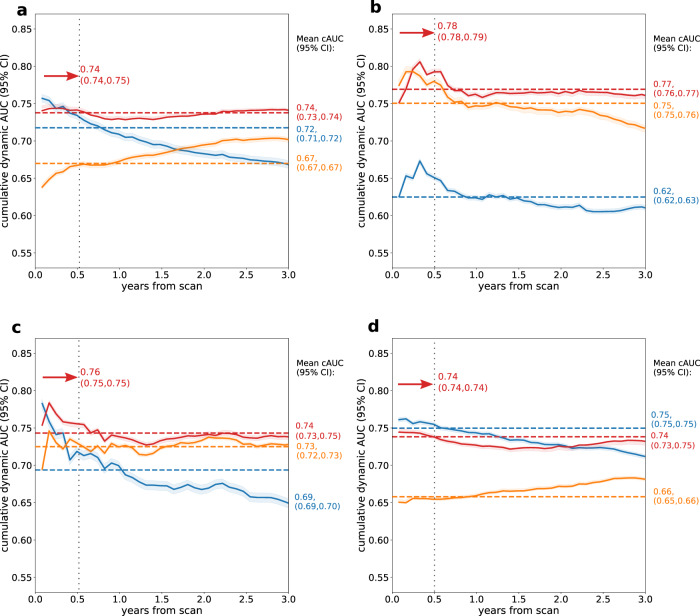
Fig. 3. Cumulative dynamic areas under the receiver operating characteristic curve (cAUC) in the external testing set.
The cAUCs are presented for the prediction of any adverse event (a) as well as specific events: all-cause death (b), acute coronary syndrome (c), and revascularization (d) in the external dataset (N = 13,988). The red, blue, and orange lines represent cAUC for the time-to-event model, perfusion abnormality, and clinical-only model, respectively. The red, blue, and orange dashed lines represent mean cAUC for the time-to-event model, perfusion abnormality, and clinical-only model, respectively. Shaded areas represent 95% confidence intervals (CI). The red arrows show the cAUC values of time-to-event deep learning averaged over the first six months after the scan (vertical dashed line).

