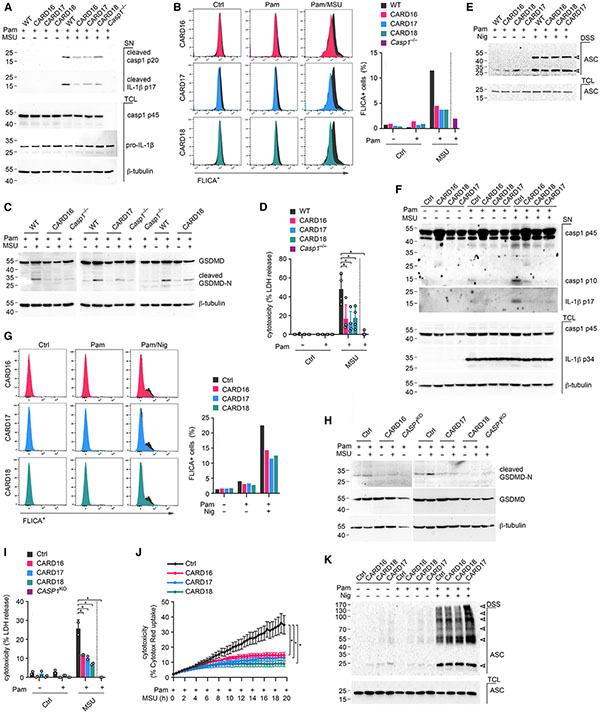
Figure 4. COPs inhibit caspase-1 activation and pyroptosis in macrophages.
(A–E) Wild-type (WT), COPTG (CARD16, CARD17, CARD18) and Casp1−/− BMDM were (A) primed with Pam3CSK4 (Pam) (1 μg mL−1, 4 h) and activated with MSU crystals (180 μg mL−1, 2 h) and culture supernatants (SN) and total cell lysates (TCL) analyzed by SDS-PAGE and immunoblot; (B) primed with Pam (1 μg mL−1, 1 h), activated with MSU crystals (180 μg mL−1, 3.5 h), and incubated with an FLICA substrate (10 μM) to determine caspase-1 activity by flow cytometry (FLICA+ cells from a representative experiment are presented, n = 3); (C) primed with Pam (1 μg mL1, 4 h) and activated with MSU crystals (180 μg mL−1, 2 h) (TCL were analyzed by SDS-PAGE and immunoblot); (D) treated with Pam (1 μg mL−1, 4 h) and activated with MSU crystals (180 μg mL−1, 2 h). SN were analyzed for lactate dehydrogenase (LDH) release, presented as percent cytotoxicity compared with maximum LDH release (n = 3, mean ± SD). *p < 0.05. The dotted line indicates that Casp1−/− BMDMare only present in the primed and activated treatment group; (E) primed with Pam (1 μg mL−1, 4 h) and activated with nigericin (Nig) (10 μM 45 min). Disuccinimidyl suberate (DSS) crosslinked and total ASC was analyzed by SDS-PAGE and immunoblot. Arrows indicate mono- and oligomeric ASC. (F–K) Control (Ctrl), CARD16, CARD17, and CARD18 expressing THP-1 cells were (F) primed with Pam (1 μg mL−1, 4 h), activated with MSU crystals (180 μg mL−1, 2 h), and TCL and SN were analyzed by SDS-PAGE and immunoblot; (G) primed with Pam (1 μg mL−1,1 h), activated with Nig (5 μM, 2 h), and incubated with an FLICA substrate (10 μM) to determine caspase-1 activity by flow cytometry (FLICA+ cells from a representative experiment are presented, n = 3); (H) primed with Pam (1 μg mL−1, 4 h), activated with MSU crystals (180 μg mL−1, 1 h), and TCL were analyzed by SDS-PAGE and immunoblot together with CASP1KO THP-1 cells; (I) primed with Pam (1 μg mL−1, 4 h), activated with MSU crystals (180 μg mL−1, 1 h), and LDH release was quantified and presented as percent cytotoxicity compared with maximum LDH release (n = 3, mean ± SD, *p < 0.05). CASP1KO THP-1 cells are separated by a dotted line, indicating that they are only present in the primed and MSU-activated treatment group; (J) primed with Pam (1 μg mL−1) and incubated with Cytotox Red (250 nM) for 3 h prior to activation with MSU crystals (100 μg mL−1) and live cell imaging for 16 h. Cell death was quantified from 9 images/well (n = 4–5, mean ± SD, *p < 0.05); (K) primed with Pam (1 μg mL−1, 4 h) and activated with Nig (10 μM, 45 min). DSS crosslinked and total ASC were analyzed by SDS-PAGE and immunoblot. Arrowheads indicate mono- and oligomeric ASC.
See also Figures S2 and S3.

