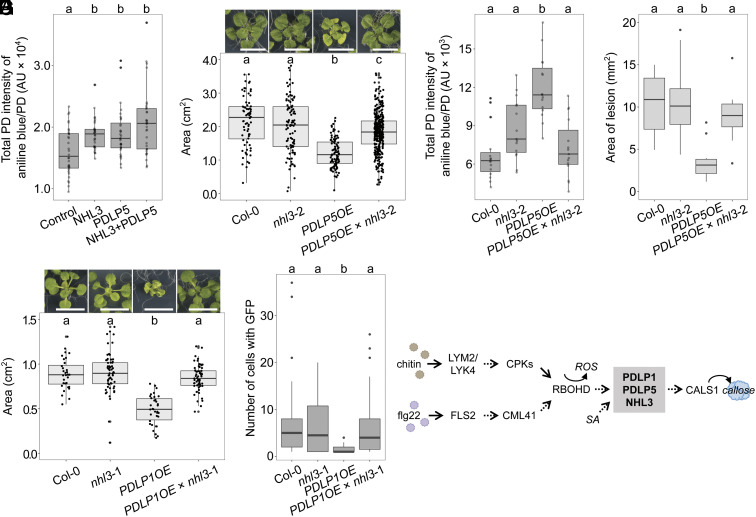
Fig. 4.
NHL3 positively regulates callose deposition at plasmodesmata and is essential for PDLP function. (A) Quantification of aniline blue–stained plasmodesmata-associated callose using automated image analysis in N. benthamiana transiently expressing p19 only (Control), NHL3-mCherry (NHL3), PDLP5-eGFP (PDLP5) or NHL3-mCherry and PDLP5-eGFP (NHL3+PDLP5). Combined data from two independent experiments, with four images from four plants taken per construct combination in each experiment. Independent factor gene expressed was determined as significant (ANOVA: F = 8.6, df = 3, P < 0.0001), with significant differences denoted by a and b, P < 0.05. (B) Whole rosette area of 21-d-old plants of Col-0, nhl3-2, PDLP5OE, and PDLP5OE × nhl3-2. Combined data from two independent experiments with random effects being "experiment" and 'the different individual plates plants were grown’. Independent factor "Genotype" was determined as significant (ANOVA: F = 80.3, df = 3, P < 0.0001), with significant differences denoted by a, b, and c, P < 0.0001. For Col-0, nhl3-2, PDLP5OE, and PDLP5OE × nhl3-2, n = 72, 97, 100, and 318, respectively. (Scale bar is 1 cm.) (C) Quantification of aniline blue–stained plasmodesmata-associated callose using automated image analysis in 3-wk-old Arabidopsis leaves, with three images for five plants taken per genotype. Independent factor genotype was determined as significant (ANOVA: F = 14.0, df = 3, P < 0.0001), with significant differences denoted by a and b, P < 0.01. (D) Average area of Botrytis cinerea disease lesions 2 dpi in leaves of 5-wk-old Col-0, nhl3-2, PDLP5OE, and PDLP5OE × nhl3-2, with N = 10 for all genotypes. Independent factor genotype was significant (ANOVA; F = 9.7, df = 3, P < 0.0001), with significant differences denoted by a and b, P < 0.01. (E) Whole rosette area of 21-d-old Col-0, nhl3-1, PDLP1OE, and PDLP1OE × nhl3-1. Independent factor genotype was significant (ANOVA: F = 45.4, df = 3, P < 0.0001), with significant differences denoted by a and b, P < 0.0001. n for Col-0, nhl3-1, PDLP1OE and PDLP1OE × nhl3-1 is 32, 64, 34, and 63, respectively. (Scale bar is 1 cm.) (F) Number of cells showing GFP movement following microprojectile bombardment in Col-0, nhl3-1, PDLP1OE, and PDLP1OE × nhl3-1 (n ≥ 44 bombardment sites). Significant differences denoted by a and b, P < 0.05. (G) Model of elicitor-induced plasmodesmal closure shows that MAMP elicitors chitin and flg22 activate different receptor complexes that signal via specific pathways to RBOHD. RBOHD produces ROS that transmit plasmodesmal signals downstream, converging with SA-elicited signals at a PDLP1/PDLP5/NHL3 signaling node that integrates the information and activates CALS1 to produce callose and close plasmodesmata. Established paths are indicated by solid arrows, and yet to be understood paths are indicated by dashed arrows. Alternative model in SI Appendix, Fig. S11.

