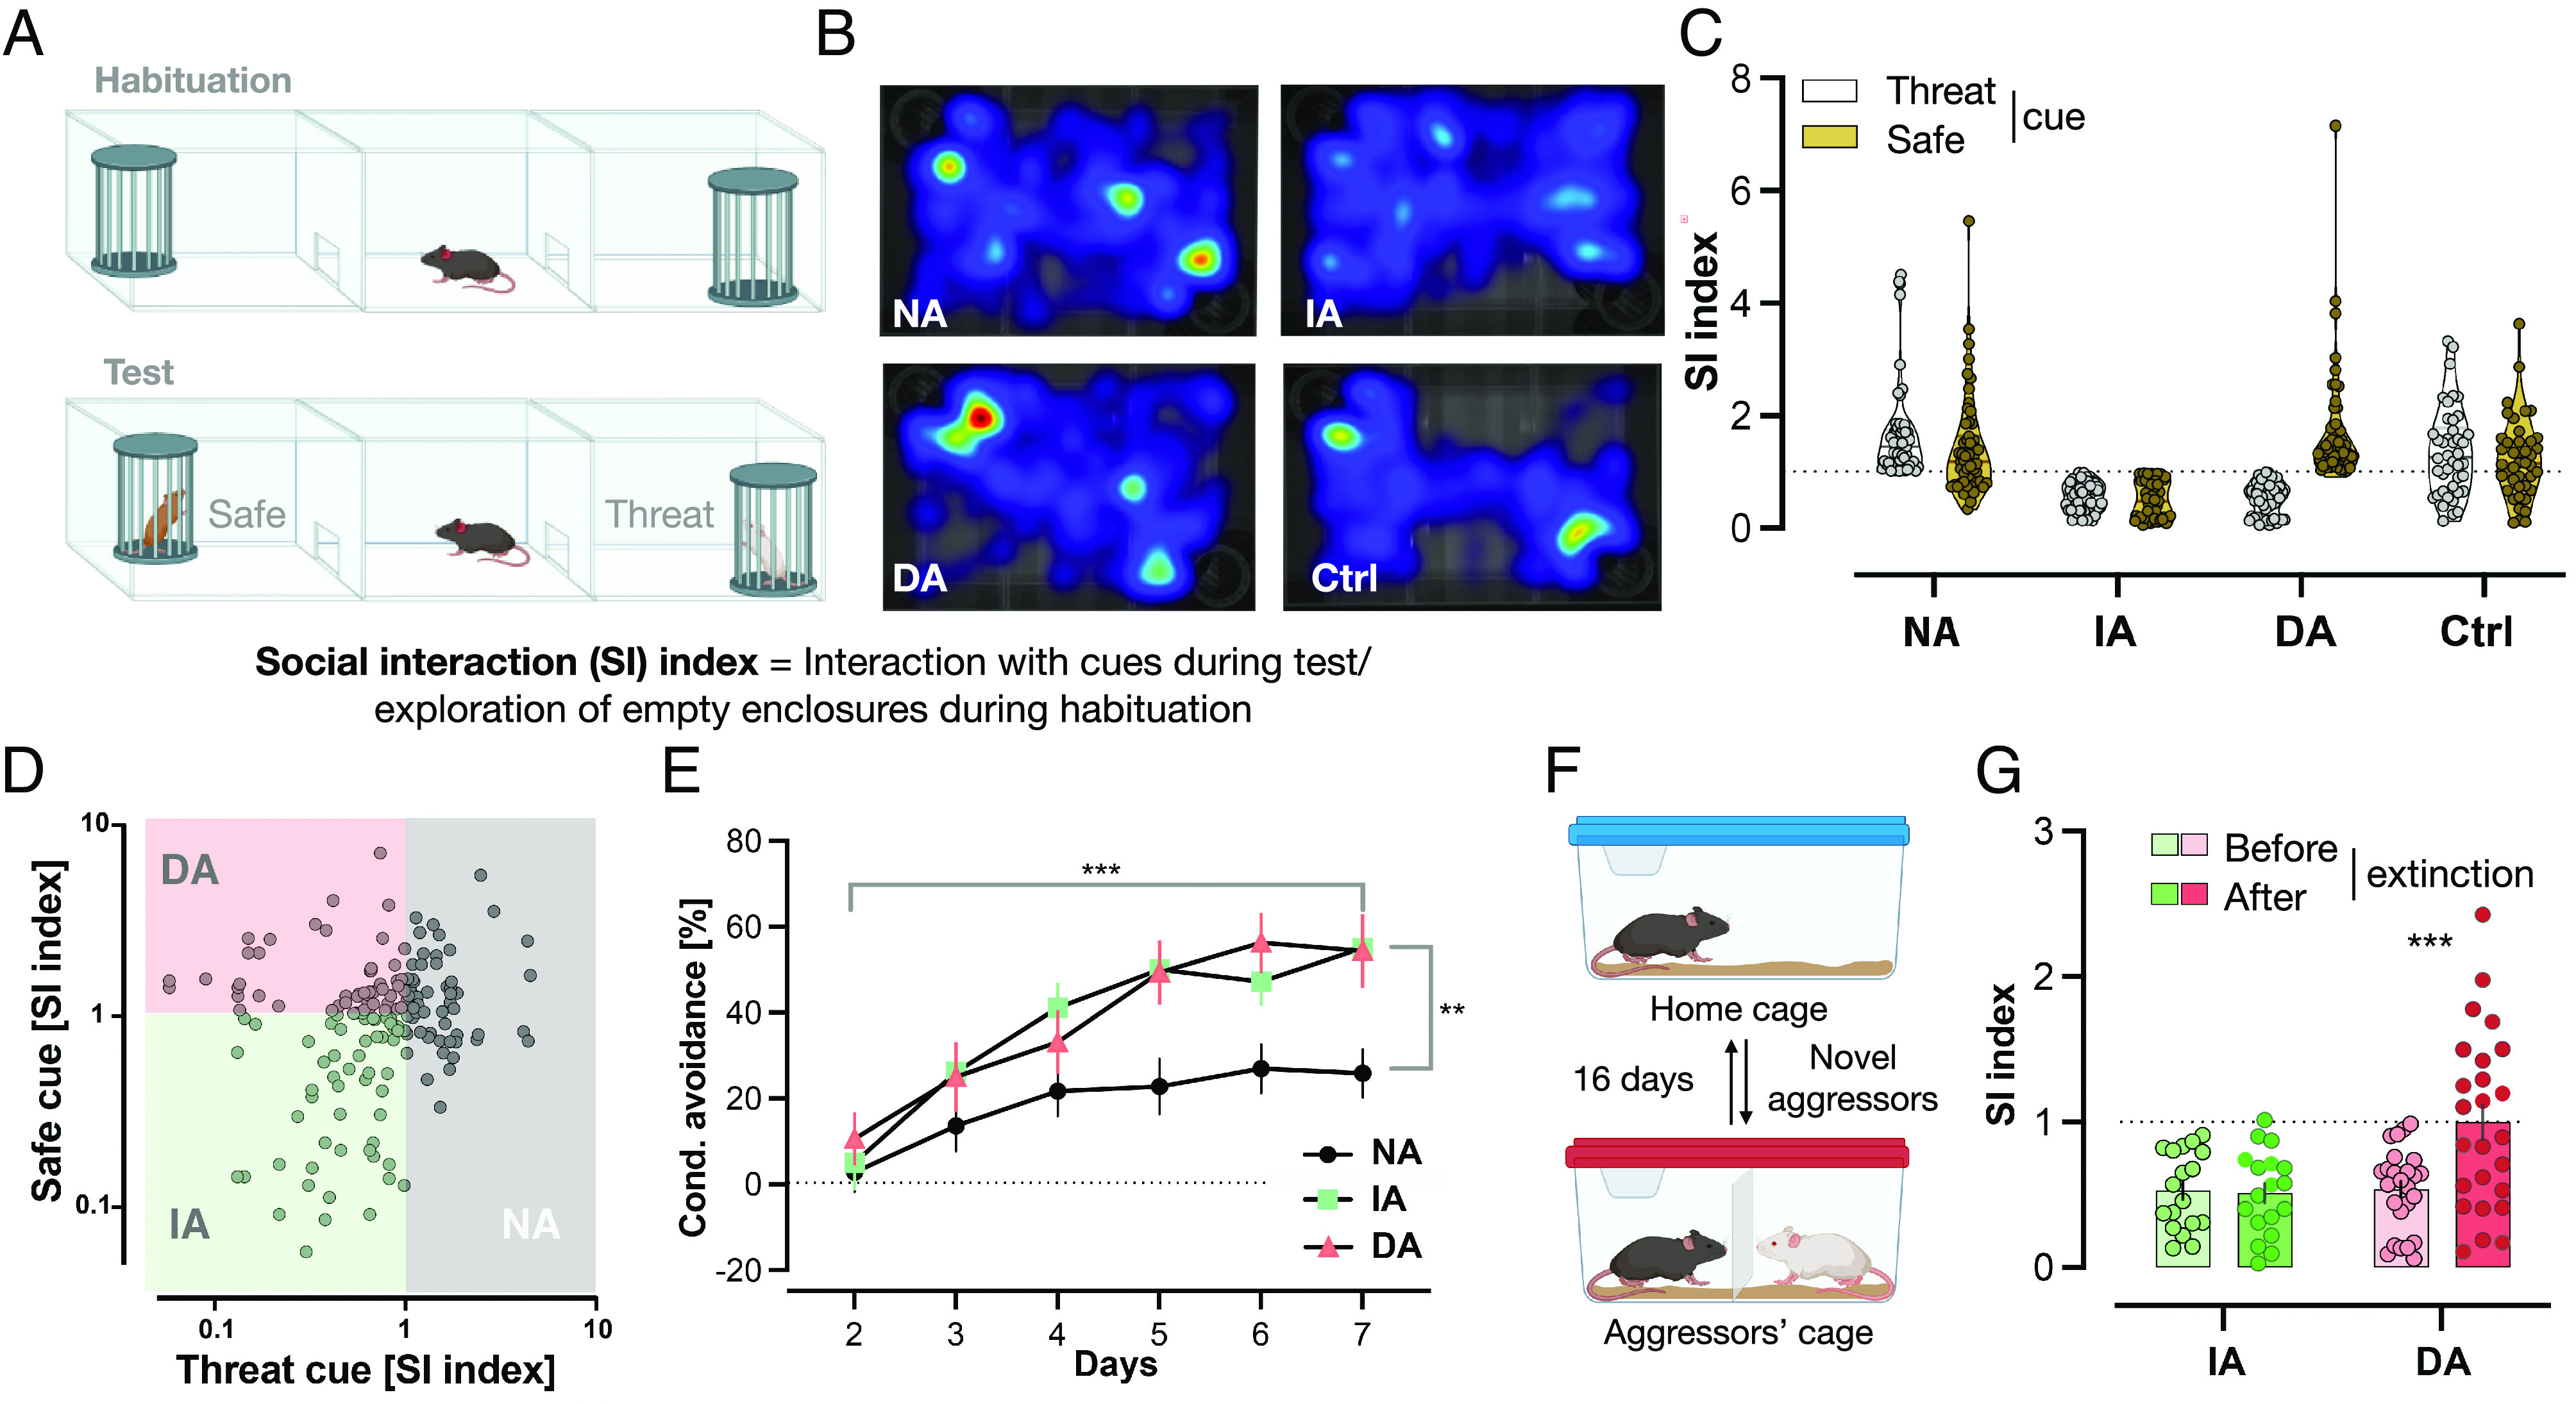
Fig. 1.

The STST identifies three distinct phenotypes within a defeated group. (A) STST: Following the habituation phase, the testing phase took place where two novel cues were presented with one belonging to the same strain that defeated the mice during CSD days (threat), while the other belonging to a novel strain (safe). (B) Differing occupancy of areas within the arena between the different subgroups: Representative heatmaps of each subgroup during the testing phase of STST. Darker colors indicate more time spent in the area. (C) STST identifies three phenotypic subgroups within a single defeated group: Mice with a social interaction index ≥1 with the threat-associated cue were termed Non-avoiders (NA; n = 55), mice with a social interaction index <1 with both strains were termed Indiscriminate-avoiders (IA; n = 54), and mice with a social interaction index ≥1 only with the safe cue were termed Discriminating-avoiders (DA; n = 56). Nondefeated Control (Ctrl; n = 42) had similar indices with both strains. Results are presented as truncated violin plots. Each animal is represented by two data points, one with each cue. (D) Scatter plot of the same data from C. (E) Non-avoiders show impairment in conditioned learning of aversive cues: All Defeated subgroups had a significant increase in conditioned avoidance response% throughout the training days; however, the Non-avoiders did so to a lesser extent with a significantly lower value on the seventh (last) day compared to the other two subgroups. Results are presented as mean ± SEM, two-way ANOVA, days: F (5, 160) = 46.27, P < 0.0001***, subgroups: F(2, 32) = 4.359, P = 0.0212*, interaction: F(10, 160) = 3.042, P = 0.0015**. Bonferroni’s multiple comparisons test on last day: DA (n = 8) vs. IA (n = 9), P = ns, DA or IA vs. DA (n = 18), P < 0.01**. (F) Social Avoidance Extinction Training: Mice were placed for 15 min in the same cages of the same aggressors from CSD days with a mesh wall in-between before being returned to their home cages. The training took place for 16 d; every day, a new aggressor was encountered. (G) Indiscriminate-avoiders display resistance to extinction of averse memories: The DA (n = 25) had a significantly greater social interaction (SI) index with the aggressors’ strain in the STST following extinction training compared to their index in the test before the training (following CSD), whereas the IA (n = 18) maintained similar indices between both time points. Results are presented as mean ± SEM, two-way ANOVA, extinction training: F (1, 41) = 7.092, P = 0.0110**, subgroups: F(1, 41) = 7.061, P = 0.0112**, interaction: F(1, 41) = 8.293, P = 0.0063**, and Bonferroni’s multiple comparisons test within each subgroup: before vs. after extinction, P = 0.0002***.
