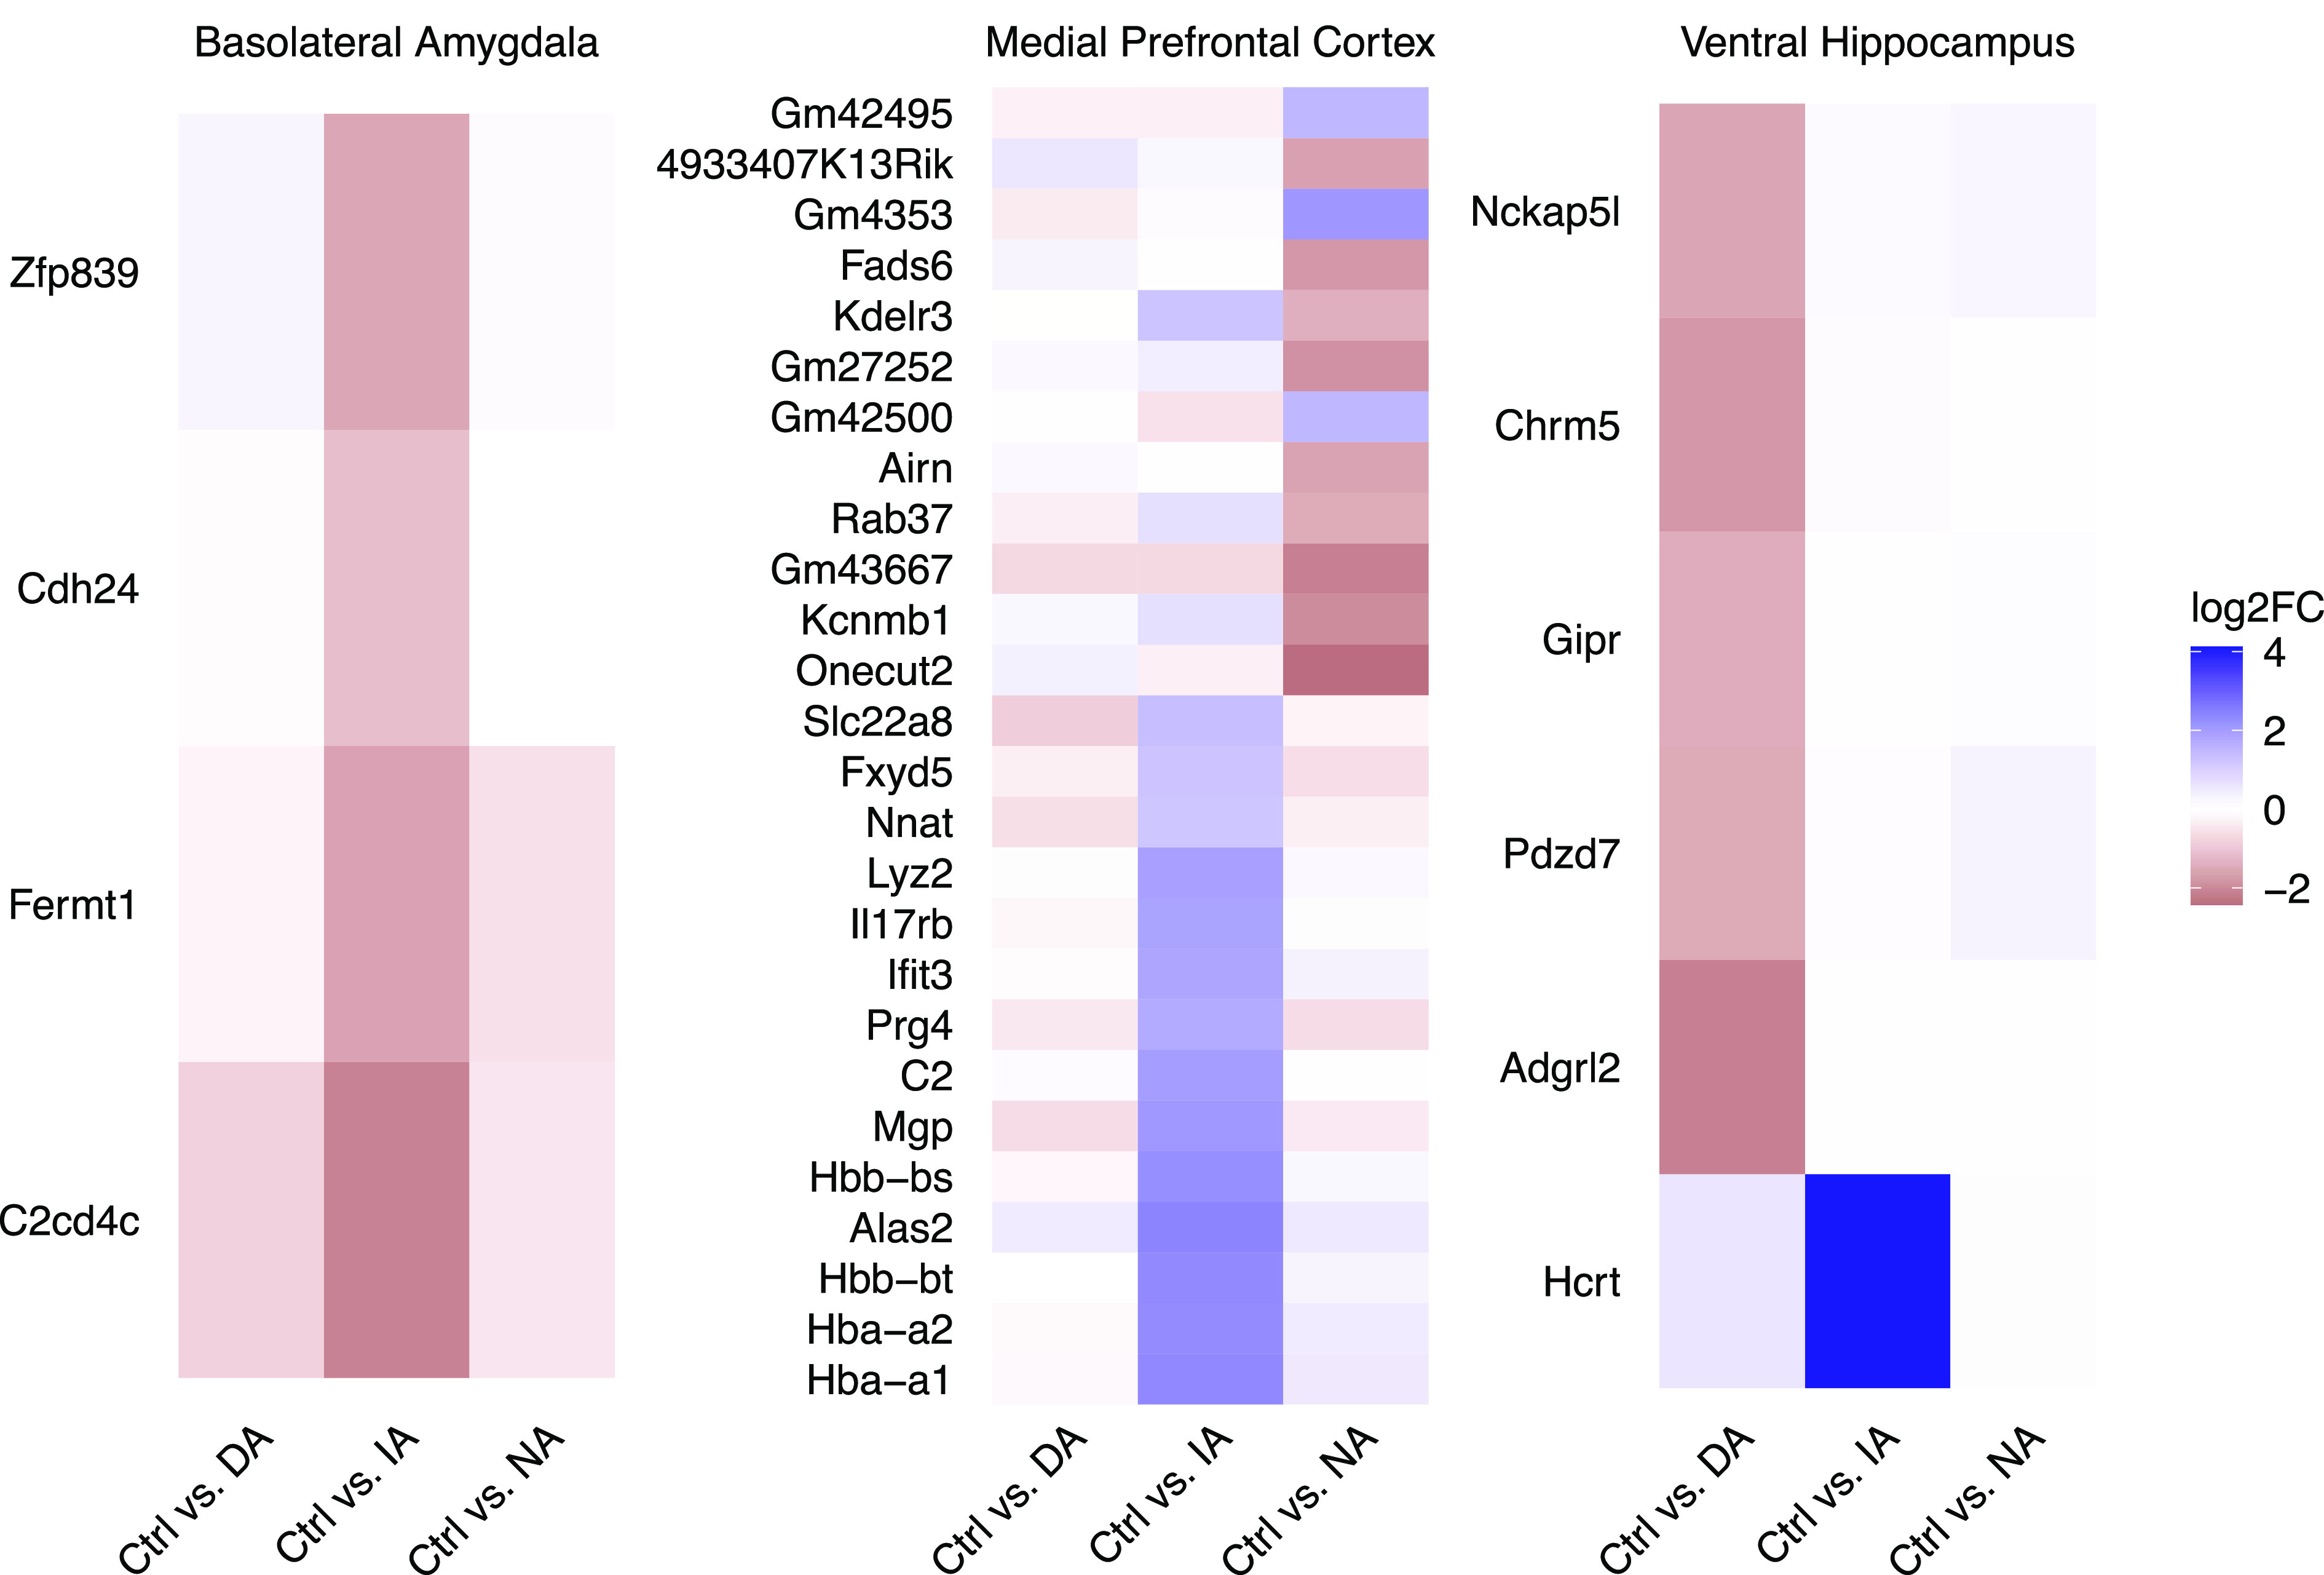
Fig. 3.

Subgroup- and brain region-specific DEGs. Heatmaps of identified subgroup-specific DEGs in blA, mPFC, and vHC: For each region, change of gene expression between the nondefeated Control group (Ctrl) and each of the three Defeated subgroups is shown. The color code represents the log2 fold change of the average normalized gene expression where blue values indicate greater expression in the respective Defeated subgroup compared to the Control group. Discriminating-avoiders (DA), Indiscriminate-avoiders (IA), and Non-avoiders (NA), n = 4 to 7 per subgroup.
