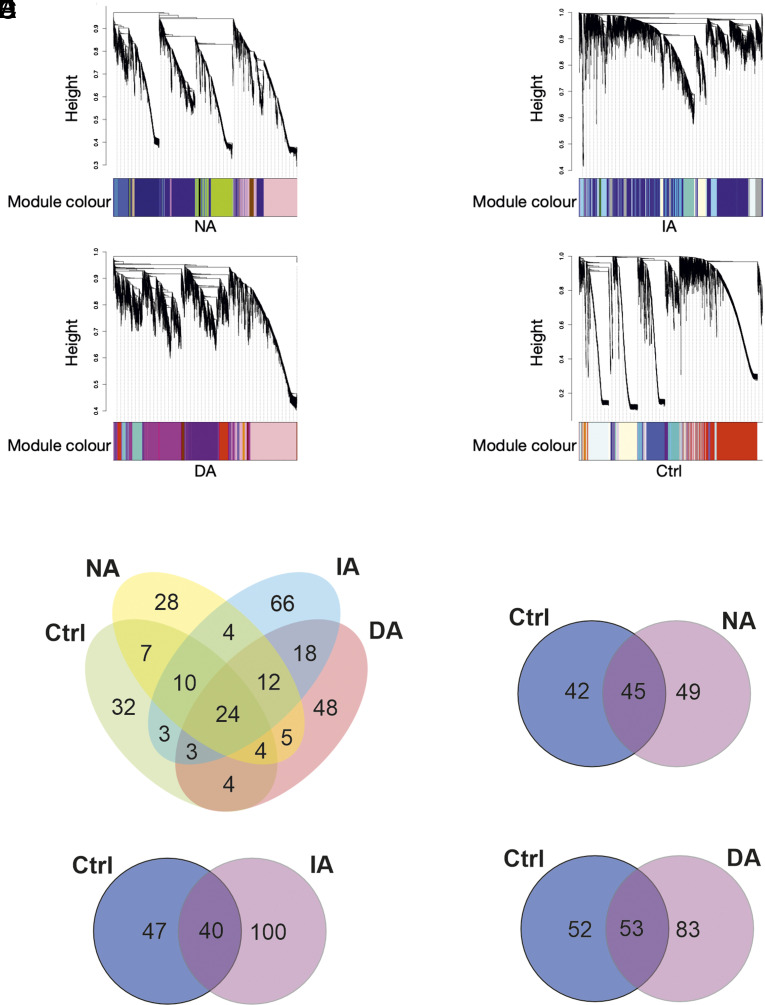
Fig. 4.
Subgroup-specific gene coexpression networks. (A) Defeated subgroups exhibit a considerably different similarity structure of modules: Gene expression similarity structure across modules of coexpressed genes identified within the three different Defeated subgroups and the Control (Ctrl) group. Height of the dendrogram corresponds to dissimilarity of gene expression profiles across samples from all animals (lower value=more similar) used for clustering genes into modules. Colors of modules are arbitrarily assigned within each subgroup. (B) More subgroup-specific functionally enriched terms of modules than shared: While 24 terms are shared across all subgroups, 32 terms are specific to the Control (Ctrl) group and between 28 and 66 terms are specific to one of the three Defeated subgroups. (C–E) Unique numbers of functionally enriched terms of modules between the Control group and each of the three Defeated subgroups: Control (Ctrl) group-specific terms seen as “lost” in the respective Defeated subgroup, and Defeated subgroup-specific terms seen as “gained.” Note that the terms “loss” and “gain” reflect change of expression pattern and not of function. Non-avoiders (NA) n = 17, Indiscriminate-avoiders (IA) n = 19, Discriminating-avoiders (DA) n = 15, and Control (Ctrl) n = 15.

