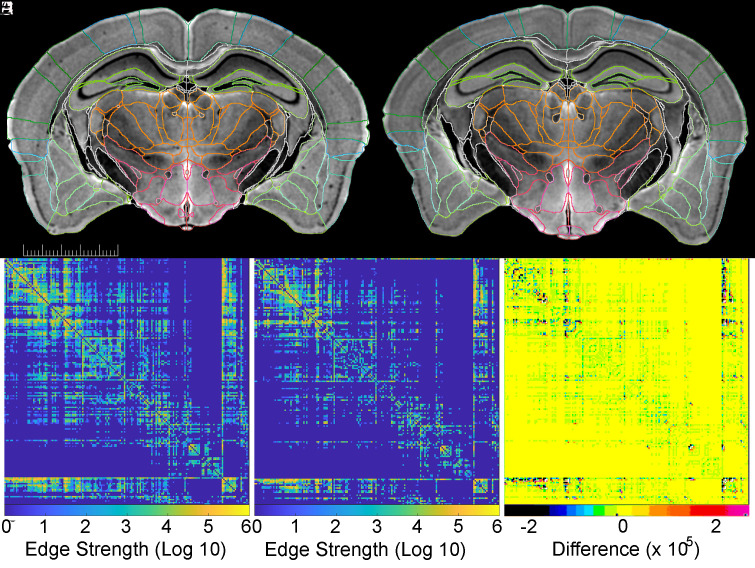
Fig. 5.
Quantitative tractography applied to BXD89 males. (A) (111 d) and (B) (687 d) are matched DWIs of specimens that differ by 19 mo. The scale bar is 5 mm. (C and D) are matched connectomes of the same young and old specimens that provide a measure (log10 scale) of the connection strength of each of 179 of 180 ROIs in the right hemisphere with all other right-hemisphere ROIs (one ROI is the whole hemisphere). (E) Difference of (C and D) scaled to allow the reader to appreciate where there is difference.

