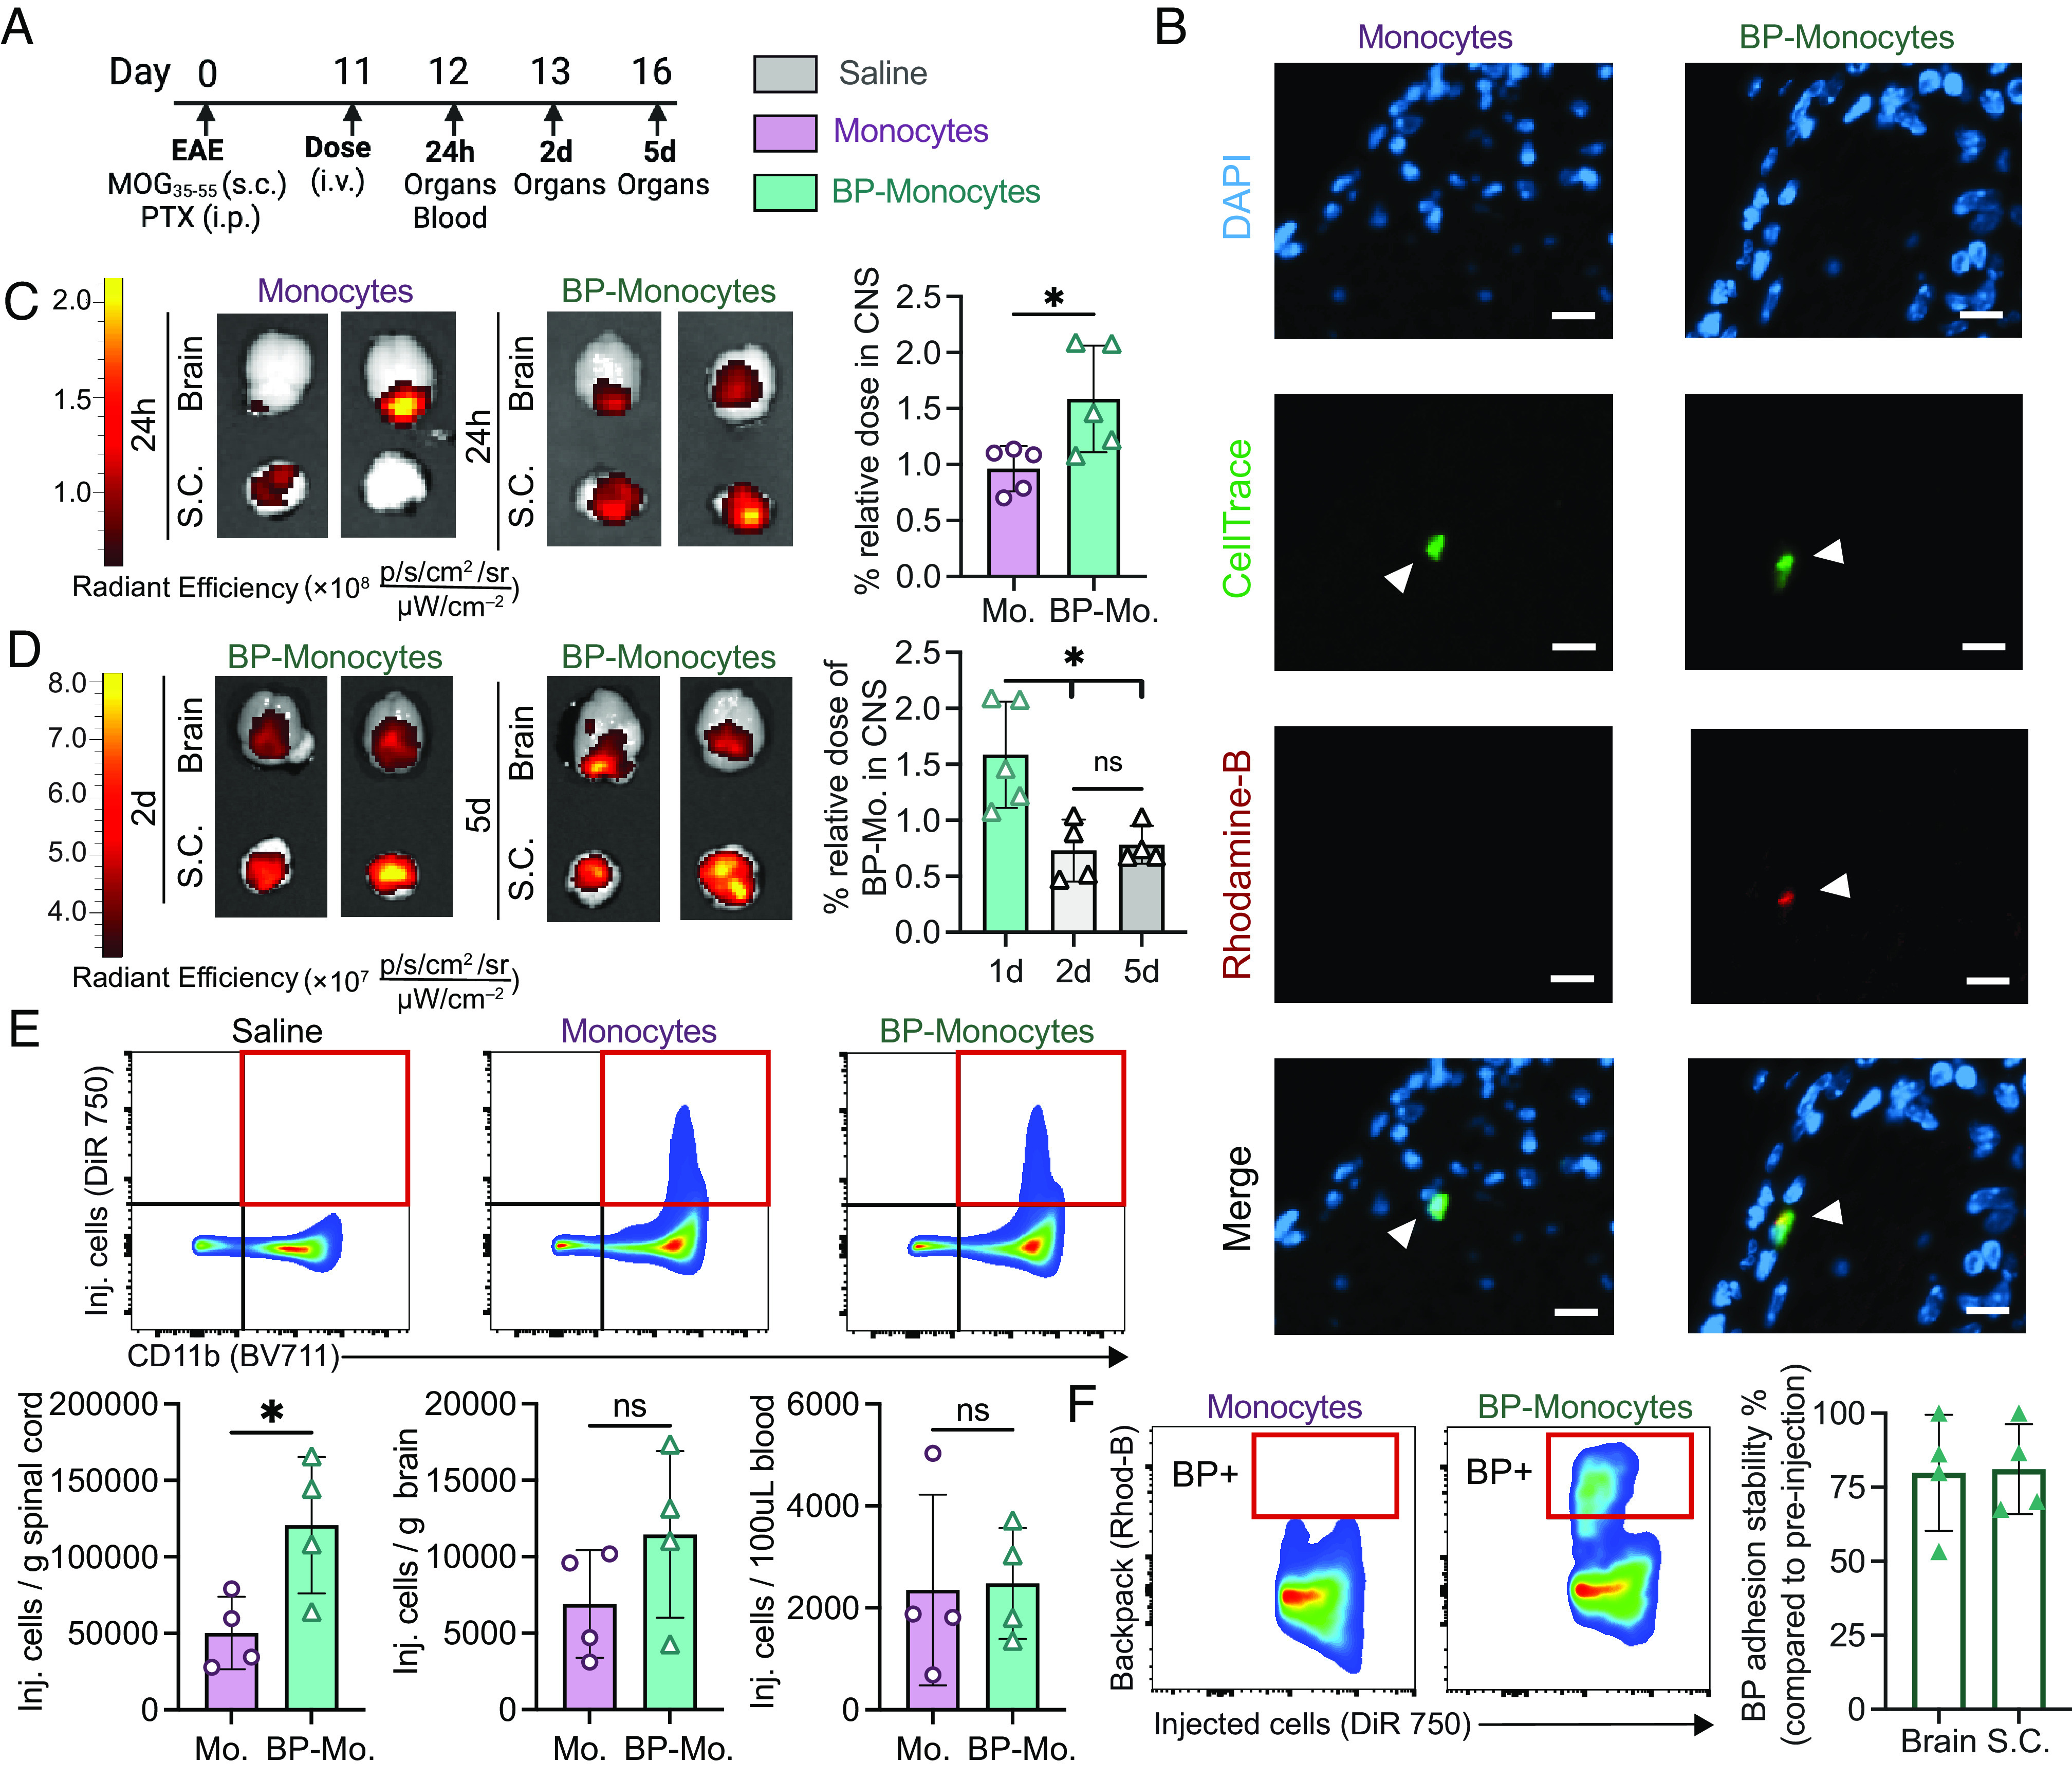
Fig. 3.

Backpack-carrying monocytes migrate to the CNS of EAE mice. EAE was induced in female C57BL/6J mice. (A) The mice were treated with 3 × 10⁶ monocytes or backpack-monocytes or saline (i.v. tail vein) at the onset of clinical signs on day 11, with the adoptively transferred cells stained with DiR 750 or CellTrace Far Red. On days 12, 13, and 16, the CNS and blood were harvested for ex vivo imaging and single-cell suspension processing. (B) Fluorescence imaging of lumbar spinal cord stained for DAPI (nucleus, blue), CellTrace (adoptively transferred cells, green), and rhodamine-B [backpacks (BP), red]. (Scale bar represents 10 µm.) (C) Representative IVIS of brain and spinal cord (S.C.) displaying DiR 750 signal 24 h after monocyte (Mo.) or BP-monocyte (BP-Mo.) administration. Fluorescence quantification of relative dose accumulated in the CNS (cumulative brain and spinal cord signal) for monocytes and backpack-monocytes; mean ± SD (n = 5). (D) Representative IVIS images of brain and spinal cord displaying DiR 750 signal 2 d and 5 d hours after BP-monocyte (BP-Mo.) administration. Fluorescence quantification of relative dose accumulated in the CNS (cumulative brain and spinal cord signal); mean ± SD (n = 4). (E) Representative gating for tracking injected cells (DiR 750) after 24 h in the single-cell suspension of the spinal cord; flow cytometry quantification of adoptively transferred cells in the single-cell suspensions of the spinal cord, brain, and blood; mean ± SD (n = 4). (F) Representative flow cytometry gating and quantification for backpack attachment to adoptively transferred cells in spinal cord single-cell suspension. Adhesion stability is quantified as percent of adoptively transferred monocytes with a backpack adhered as compared to pre-injected backpack-monocyte adhesion; mean ± SD (n = 5). For C, D, E, data were analyzed using two-tailed Student’s t test; ns, not significant, *P < 0.05.
