
Fig. 3.
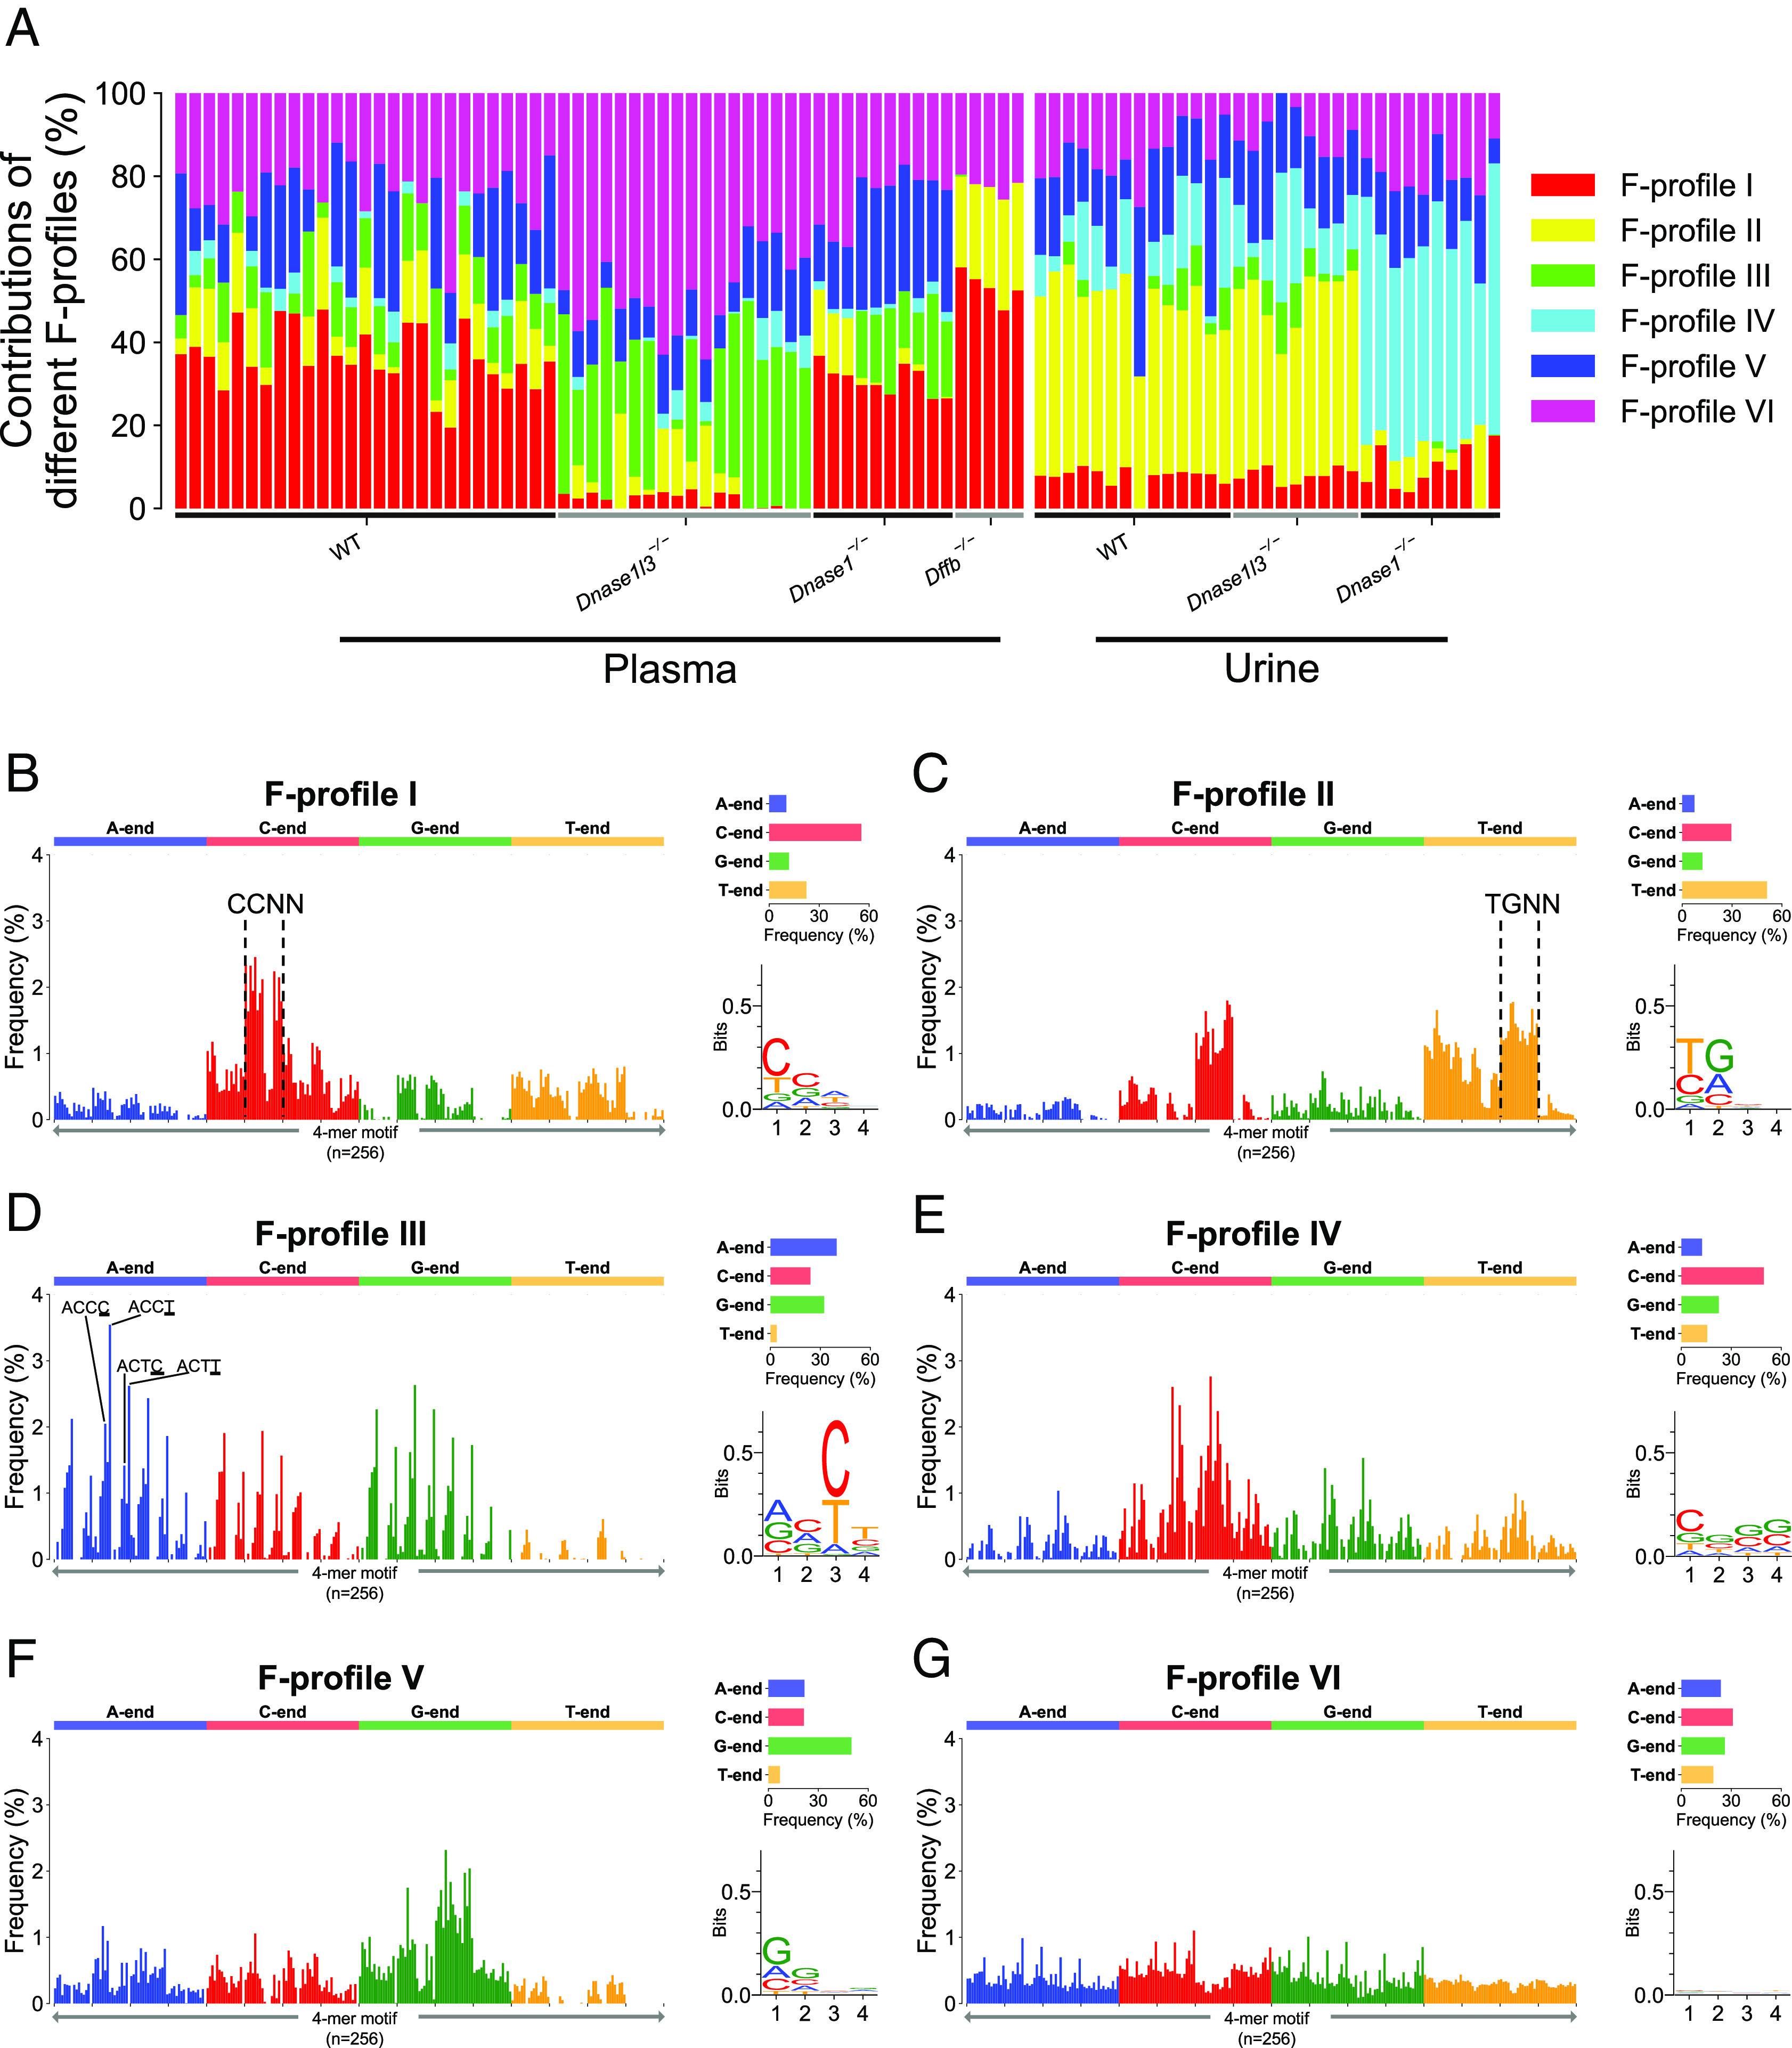
Six F-profiles deduced from mouse plasma and urinary cfDNA using NMF analysis. (A) Proportional contribution of each F-profile in murine cfDNA samples with different knockout genotypes. (B–G) Plots for the six F-profiles.
Official websites use .gov
A
.gov website belongs to an official
government organization in the United States.
Secure .gov websites use HTTPS
A lock (
) or https:// means you've safely
connected to the .gov website. Share sensitive
information only on official, secure websites.
Six F-profiles deduced from mouse plasma and urinary cfDNA using NMF analysis. (A) Proportional contribution of each F-profile in murine cfDNA samples with different knockout genotypes. (B–G) Plots for the six F-profiles.