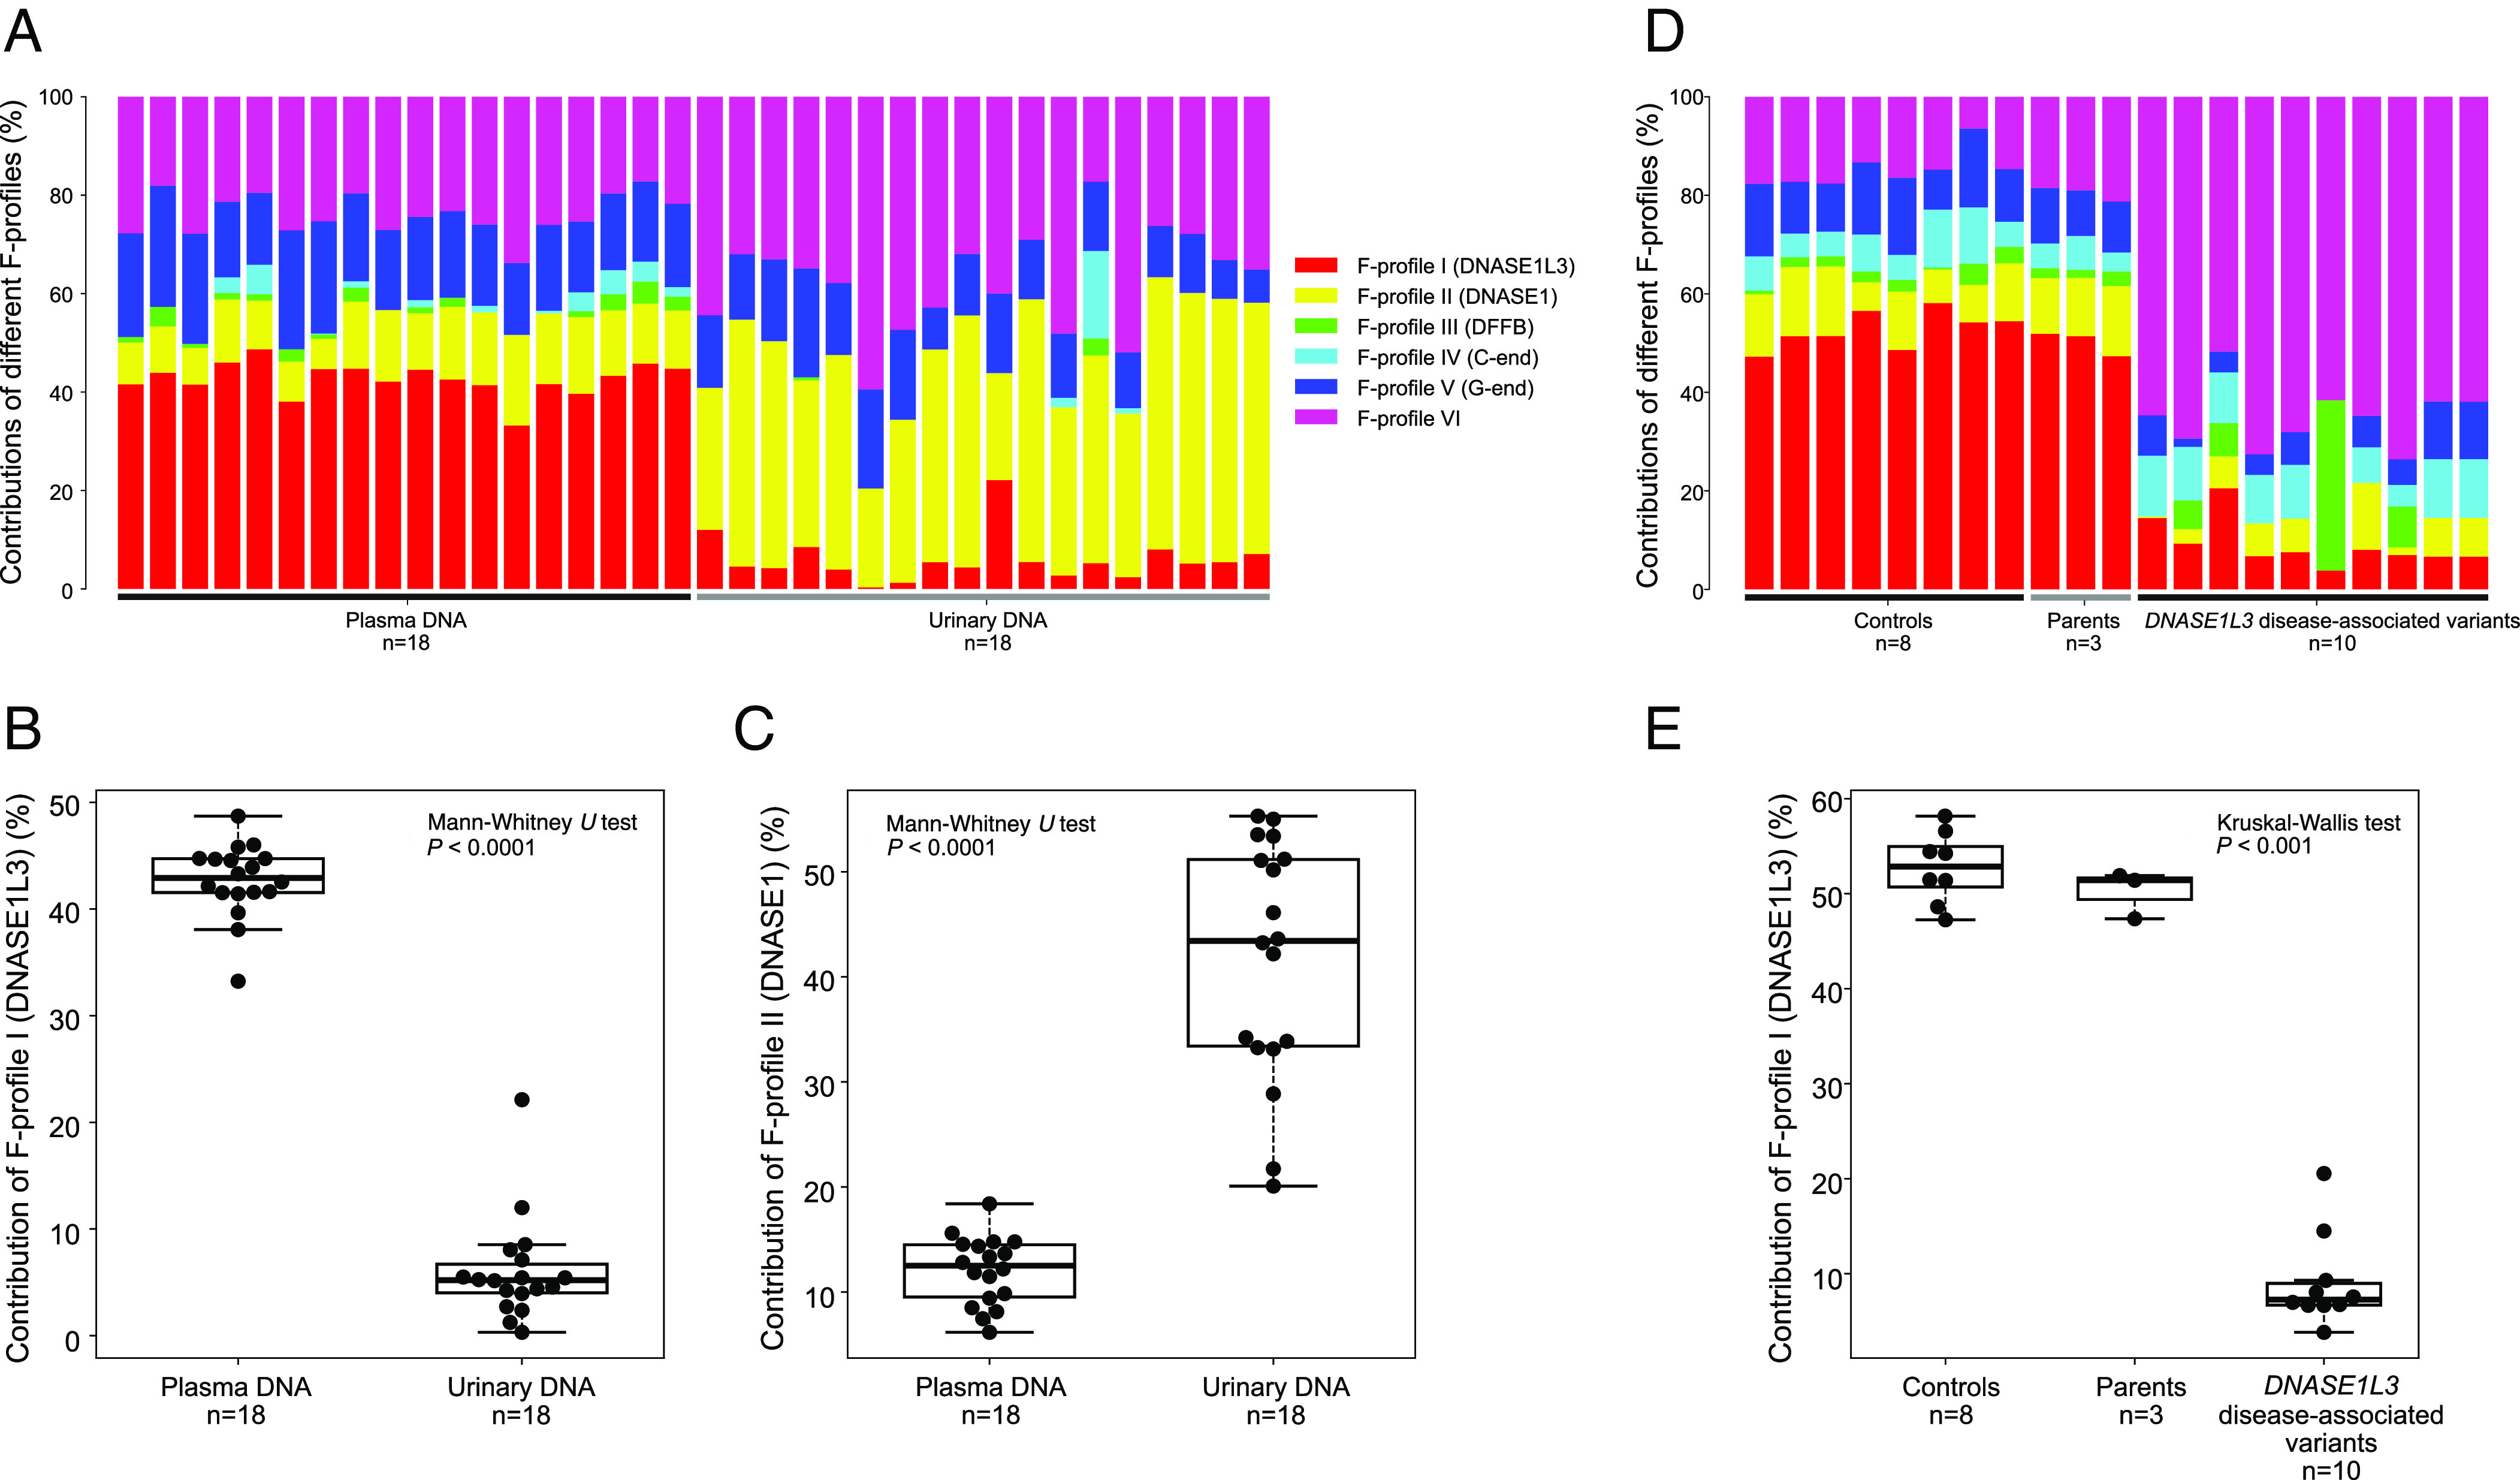
Fig. 5.

Deconvolutional analysis of end motifs in paired human plasma and urinary cfDNA samples, and human plasma cfDNA of subjects with and without DNASE1L3 deficiency. (A) Bar chart of results of deconvolutional analysis between human plasma and urinary cfDNA. (B–C) Boxplots of F-profile I and II levels between human plasma and urinary cfDNA. (D) Bar chart of results of deconvolutional analysis in plasma cfDNA between subjects with and without DNASE1L3 disease-associated variants. (E) Boxplot of F-profile I levels for healthy subjects, patients with DNASE1L3 deficiency, and parents of the patients.
