
Fig. 6.
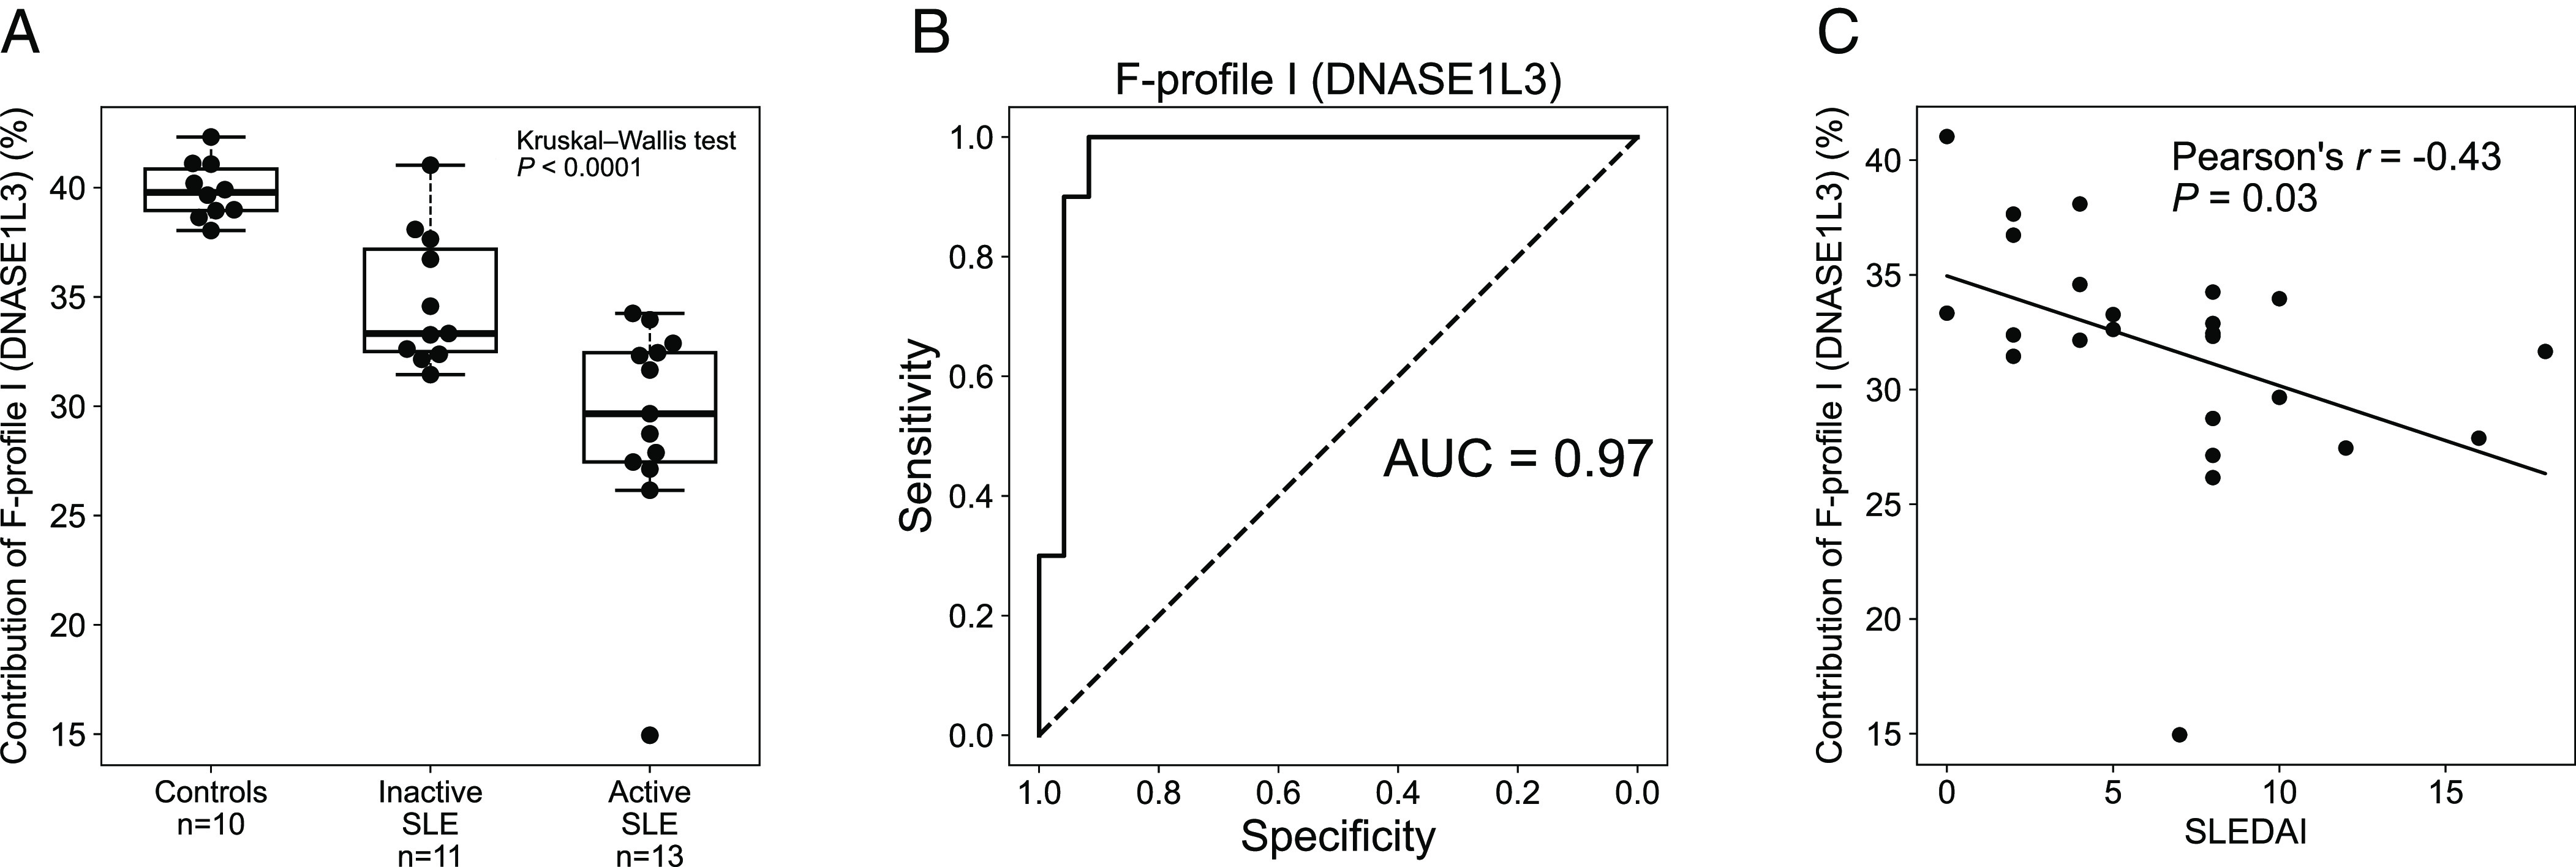
Deconvolutional analysis of end motifs in plasma cfDNA of human subjects with and without SLE. (A) Boxplot of F-profile I levels (DNASE1L3) in plasma cfDNA across healthy control subjects, patients with inactive SLE, and patients with active SLE. (B) Area under the receiver operating characteristic (ROC) curve (AUC) for differentiation between patients with and without SLE using F-profile I. (C) Correlation between the SLEDAI and F-profile I levels in patients with SLE.