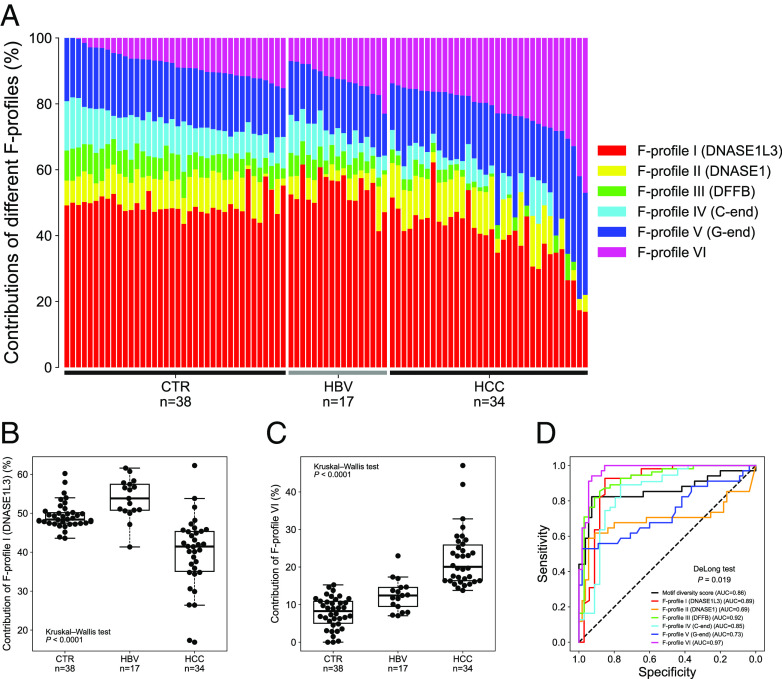
Fig. 7.
The distinct types of cfDNA cleavage analysis in plasma cfDNA of human subjects with and without HCC. (A) Bar chart of F-profile levels in plasma cfDNA of patients with and without HCC. Boxplots of F-profile (B) I and (C) VI levels in plasma cfDNA of patients with and without HCC. (D) ROC curves for the differentiation between non-HCC and HCC groups using different metrics, including motif diversity score and six F-profiles.

