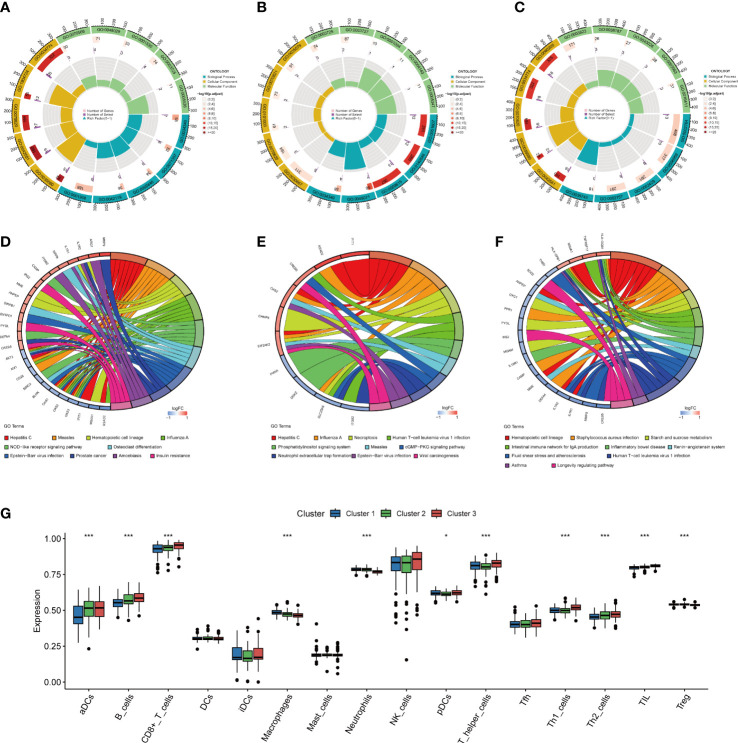
Figure 9.
Functional enrichment and immune cell infiltration analyses among three NETs subgroups. (A–C). GO enrichment analysis of DEGs highly expressed in cluster 1 (A), cluster 2 (B), and cluster 3 (C). (D–F). KEGG enrichment analysis of DEGs highly expressed in cluster 1 (D), in cluster 2 (E), and in cluster 3 (F). (G) Box plot showing the relative abundances of immune cells among three clusters, *P < 0.05, ***P < 0.001. NETs, neutrophil extracellular traps; GO, gene ontology; KEGG, Kyoto encyclopedia of genes and genomes.

