FIGURE 1.

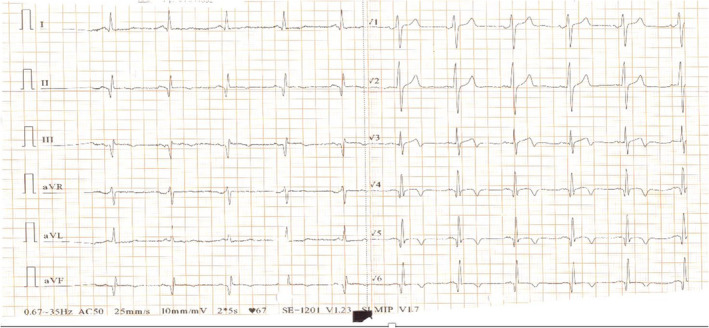
The initial electrocardiogram showed sinus rhythm with q waves in the inferior leads and negative T waves in the inferior leads, biphasic T waves in V3, and negative T waves in V4–V6 leads.

The initial electrocardiogram showed sinus rhythm with q waves in the inferior leads and negative T waves in the inferior leads, biphasic T waves in V3, and negative T waves in V4–V6 leads.