Fig. 2.
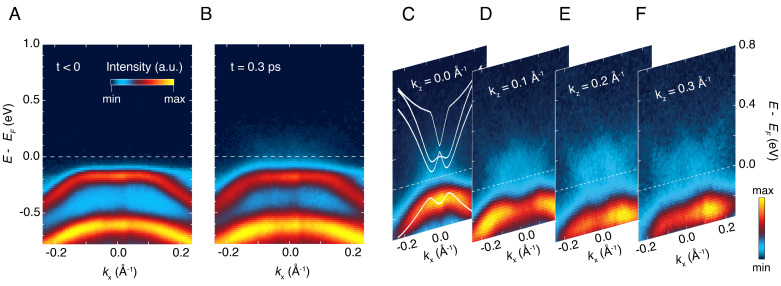
(A and B) Snapshots of the trARPES spectra along the kx momentum direction and for kz = 0 Å−1. The data have been measured at 11 K with a probe photon energy of 10.75 eV and an absorbed pump fluence of 0.4 mJ/cm2. (A) Snapshot before photoexcitation (t < 0). At the Γ point of the Brillouin zone (kx = 0 Å−1), the flat antibonding VB is located around −0.16 eV, whereas the bonding VB appears around −0.65 eV. (B) Snapshot measured at the maximum of the pump–probe response (t = 0.3 ps). Upon photoexcitation, the VB is depleted in intensity and broadens significantly. Spectral weight is transferred above EF and accumulates close to Γ. (C–F) Evolution of the photoexcited state (at t = 0.3 ps) along kx at representative kz momenta, as indicated in the labels. Note that the color scale is different from that of panels A and B. The spectral weight above EF assumes a W-like shape consistent with the dispersion of the CB. The VB and CB never cross each other, and thus, the gap size remains finite in the whole kx-kz momentum space around Γ. The white lines denote the energy–momentum dispersion calculated at the GW level (Fig. 4B). A rigid shift of −84 meV has been applied to the VB to account for the underestimated gap resulting from the GW method. The calculated dispersions have an excellent match with the experimental findings.

