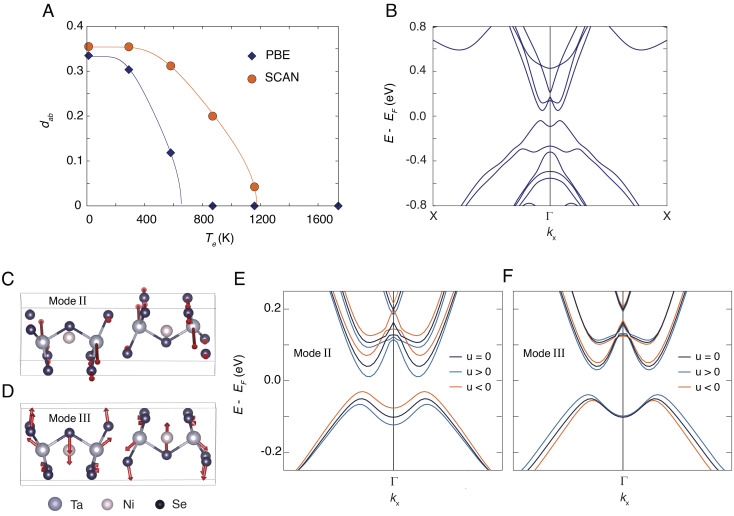
Fig. 4.
(A) Distance between the calculated monoclinic structure and the nearest orthorhombic structure, evaluated as a function of Te. In the computation, we used two different density functionals: PBE (blue symbols) and SCAN (orange symbols). The lines are fits to the standard mean-field behavior, , where TC = 328 K. (B) Calculated electronic structure of Ta2NiSe5 in the low-temperature monoclinic unit cell along the X-Γ-X momentum direction (parallel to the Ta and Ni chains). The electronic structure is computed using GW calculations. A bandgap opens in the single-particle band structure, and its lower value is close to the Γ point of the Brillouin zone (SI Appendix, section S8 for details). The VB (CB) dispersions acquire an M-like (W-like) shape around Γ, consistent with the dispersion found in experiments. (C and D) Calculated eigenvectors of the dynamical matrix of Ta2NiSe5 corresponding to modes II and III, respectively. Violet atoms refer to Ta, pink atoms to Ni, and blue atoms to Se. The phonon spectrum has been computed using DFT. To enhance the visibility of the atomic motion, the amplitude is scaled by a factor of 8. (E and F) Calculated electronic structure of Ta2NiSe5 displaced along the eigenvectors of the modes showed in panels C and D. The dark blue lines refer to the electronic structure of the initial (undisplaced, u = 0) low-temperature unit cell, whereas the light blue (orange) lines indicate the band structure for positive (negative) displacements. The electronic structures are computed on the GW level of theory.

