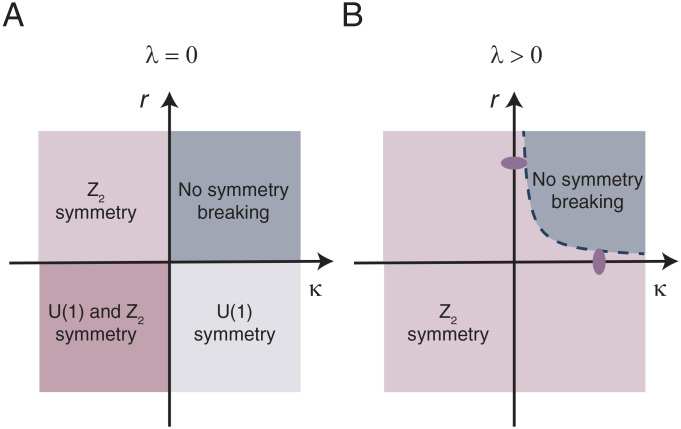
Fig. 5.
(A) Phase diagram without coupling of electrons to phonons (λ = 0). In this case, there is a U(1) symmetry in the electronic sector and a Z2 symmetry in the structural sector which can be broken independently, leading to four distinct phases. (B) Phase diagram with finite electron–phonon coupling (λ > 0). U(1) symmetry is explicitly broken by linear coupling to the phonons, leading to the three symmetry-broken phases to merge into only one Z2 phase. The purple dots signify the two limiting cases where the transition is driven by the excitonic order parameter or the crystal structure.

