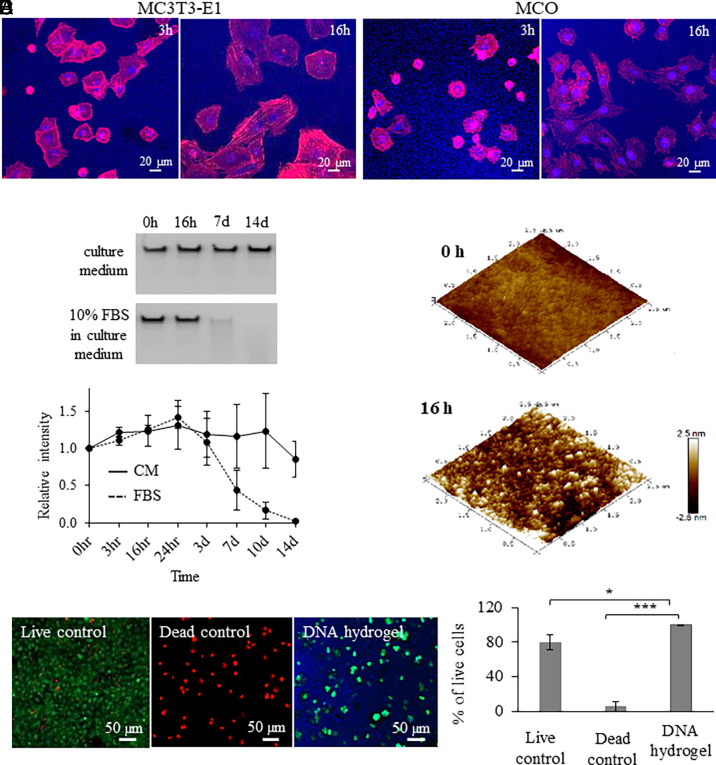
Fig. 2.
DNA hydrogel interaction and degradation with osteogenic cells. Fluorescence microscopy images of (A) MC3T3-E1 and (B) MCO cell interaction on DNA hydrogels up to 16 h. (C) (Top), Denaturing gel electrophoresis of DNA hydrogel incubated in cell culture medium or in cell culture medium with 10% FBS for up to 14 d. (Bottom), Degradation kinetics of DNA hydrogel in the presence of cell culture medium with and without 10% FBS. (D) AFM images of DNA hydrogels after 0- and 16-h incubation in cell culture medium with 10% FBS. (E) MCO cell viability assay in the presence of DNA hydrogel. Significant difference is indicated by brackets (*P < 0.05 and ***P < 0.001). Values were compared by the repeated measures ANOVA test.

