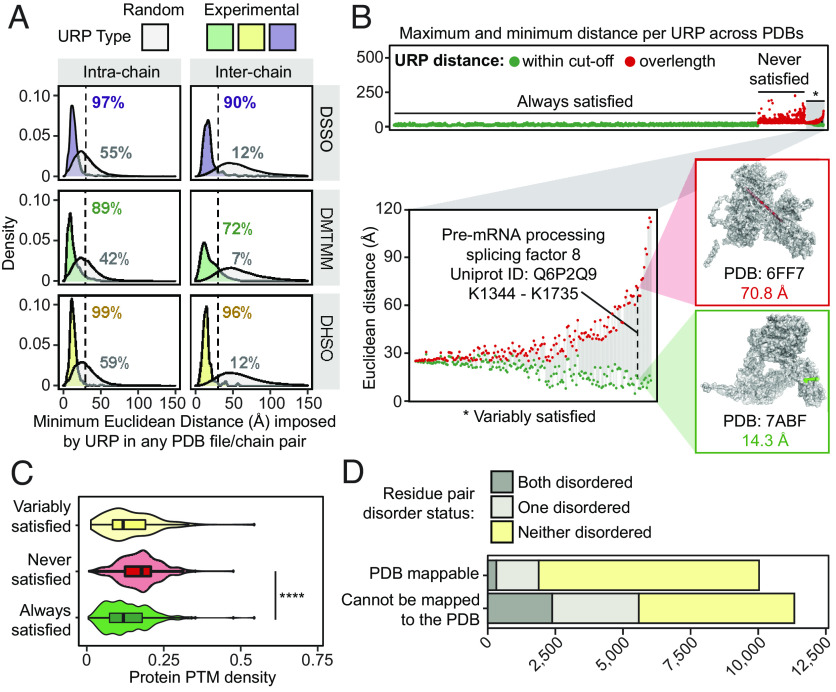
Fig. 2.
Cross-link distance constraints are validated by, and uniquely contextualize the variability within, in vitro experimental structures curated in the Protein Data Bank. (A) The distribution of minimum Euclidean distances (Å, Cα-Cα) imposed by unique residue pairs (URPs) across redundant possible chain-pairs and/or Protein Data Bank (PDB) entries. Only “unambiguous” URPs are considered in these analyses, which are those with underlying cross-linked peptide sequences that were uniquely mapped to a single protein sequence in the canonical human proteome. Random residue pairs with appropriate sidechain reactivities were simulated for each individual PDB structure. The percentage of URPs falling within the cross-linker specific distance cutoffs (dotted lines, 25 Å for DMTMM or 30 Å for DHSO/DSSO) are also indicated. (B) The range of Euclidean distances imposed by URPs mapped across multiple unique PDB entries, considering only PDB entries with one possible chain-pair configuration for the URP. The minimum and maximum distances observed for each URP are plotted in-line as circles joined by a gray line. Green fill denotes a structure for which the distance in question is falls within the relevant cutoff, and red fill denotes a structure in which the distance violates the cutoff. The Top panel shows the range distribution for all unambiguous URPs, stratified by their global satisfaction rate and ordered by increasing difference in distances within these categories. The distribution of the URP subset with variable satisfaction across PDB entries (*), is shown on the Lower Left. Inset structures to the Right show an example of a variably satisfied URP from the pre-mRNA-processing-splicing factor 8 protein (Q6P2Q9), indicated by the dashed line. (C) The density of PhosphoSitePlus-annotated posttranslational modifications (number of distinct annotated modification sites/length of protein) of cross-linked protein(s) (with the maximum value for the two proteins used for interprotein links) for each URP mapping stratification type (by variability of URP satisfaction as described above). **** is P = 2.2 × 10⁻¹⁶, from a one-tailed Wilcoxon rank sum tests with continuity corrections. (D) The distribution of unambiguous URPs involving residues from regions predicted to be disordered, stratified by whether the URPs are resolved in PDB structures.

