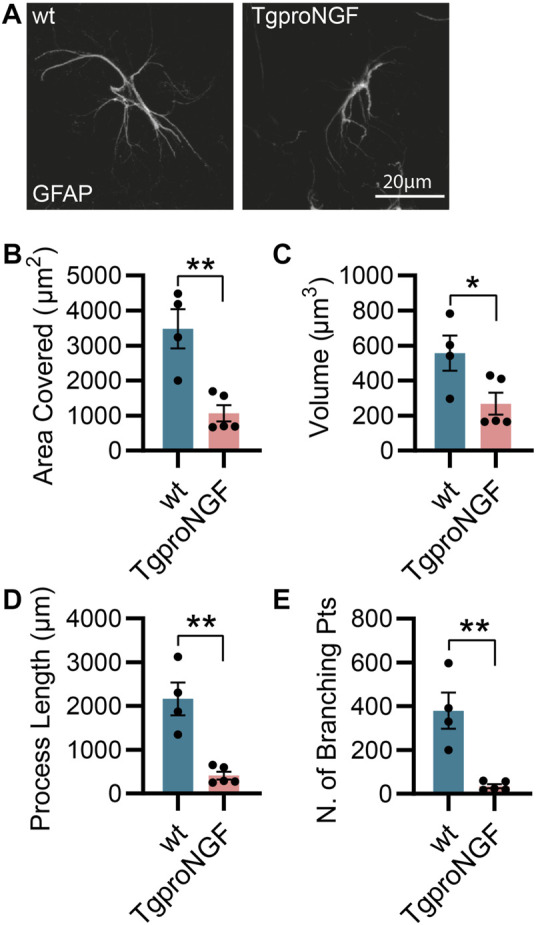
FIGURE 2.

Alterations in astrocyte morphology in vivo in 2-month-old TgproNGF#72 mice. (A) Representative images of astrocytes and their 3D reconstruction using Imaris from 2-month-old TgproNGF#72 and control mice (n = 4 control mice, n = 5 in TgproNGF#72 mice; four–five cells per animal). (B) Barplot representing the area covered by astrocyte processes in control and TgproNGF#72 mice (two-tailed unpaired t-test; p = 0.0035). (C) Barplot representing the astrocytic volume in control and TgproNGF#72 mice (two-tailed unpaired t-test; p = 0.0379). (D) Barplot representing the process length in control and TgproNGF#72 mice (two-tailed unpaired t-test; p = 0.0014). (E) Barplot representing the number of branching points in control and TgproNGF#72 mice (two-tailed unpaired t-test; p = 0.0022).
