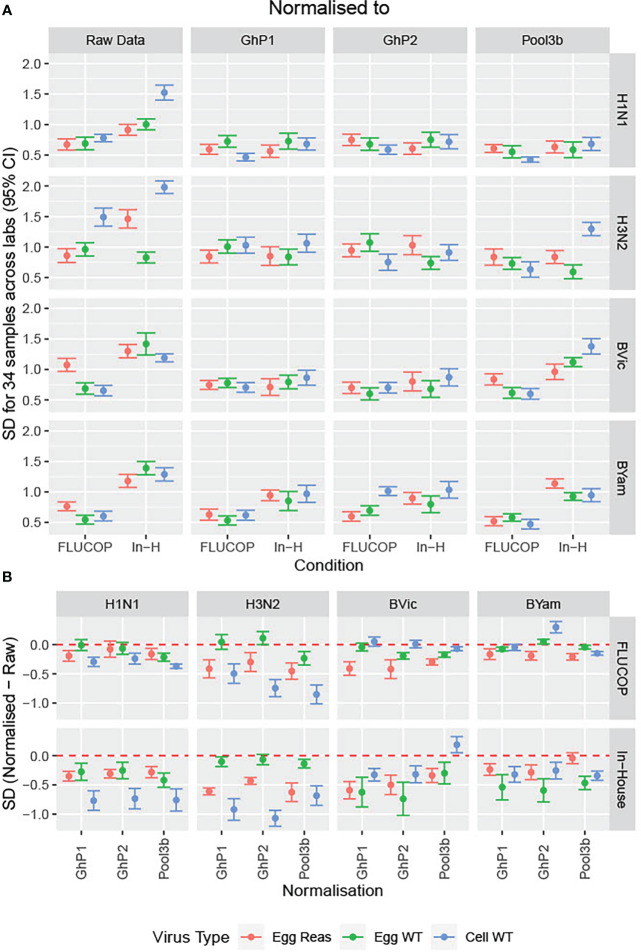
Figure 3.
Impact of normalisation on inter-laboratory variation in HAI titres. [3A] The SD was calculated across the serum panel tested. SD is shown for each influenza subtype/lineage tested as egg grown reassortant virus (red), egg grown WT virus (green) and cell grown WT virus (Blue). SD is shown before normalisation (Raw Data) and after normalisation with three pools of human sera acting as study standards: GhP1, GhP2 and Pool3b (see Table 3 for components of each pool). [3B] The differences in SD between normalised and raw data are plotted as differences between normalised and raw; values of less than 0 indicate lower SD for normalised titres than absolute titres.

