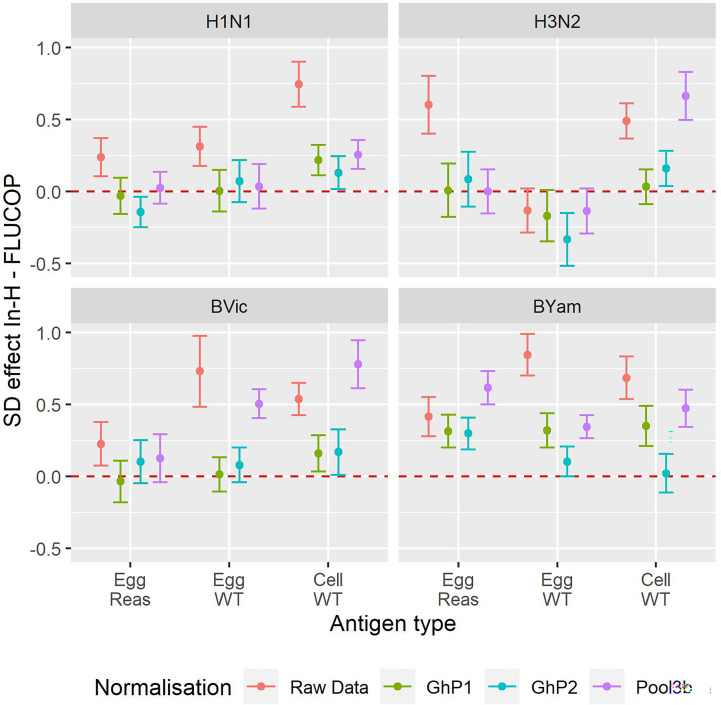
Figure 4.
Effect of antigen type, protocol type and normalisation on inter-laboratory variation. Reduction in per sample SD of the log2 titre for In-House versus FLUCOP for all available data from maximally 8 laboratories. Red = Raw Data, Brown = Ghent Pool1, Cyan = Ghent Pool2, Purple = Pool3b. H1N1 Cell WT 7 labs, H3N2 Egg WT 5 labs, BVic Egg WT 7 labs. The red dashed line represents 0 i.e where SD is the same for in-house and FLUCOP testing. Values greater than 0 indicate a higher SD for in-house testing than FLUCOP testing. Overall GMTs for each antigen type, condition and normaliser are shown in Figure S2 .

