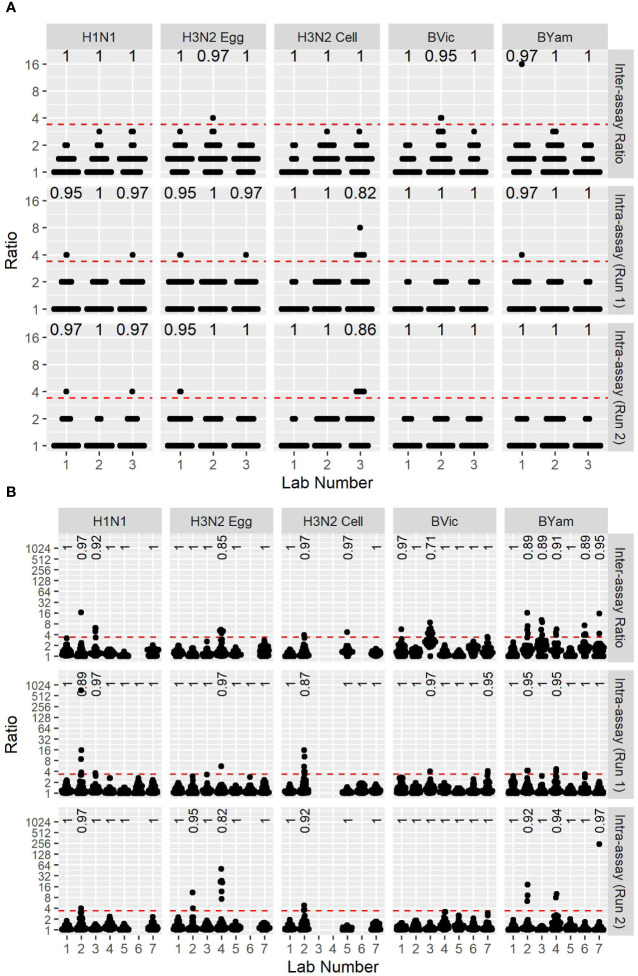
Figure 5.
Between-run and within-run variation of two MN assay formats. [5A] FLUCOP 3-5 day format MN assay max-min ratios of GMTs between two independent runs (top, Inter-assay ratio) as a measure of inter-assay (or between-run) variability, and max-min ratios of two duplicate samples in run 1 (middle – Intra-assay (Run1)) and run 2 (bottom – Intra-assay (Run2)) as a measure of intra-assay (or within-run) variability. [5B] WHO ELISA MN assay max-min ratios of GMTs between two independent runs (top, Inter-assay ratio) as a measure of inter-assay (or between-run) variability, and max-min ratios of two duplicate samples in run 1 (middle) and run 2 (bottom) as a measure of intra-assay (or within-run) variability. Red dashed line represents the ratio cut-off of 3.5. Numbers at the top of each panel indicate the fraction of datapoints < 3.5.

