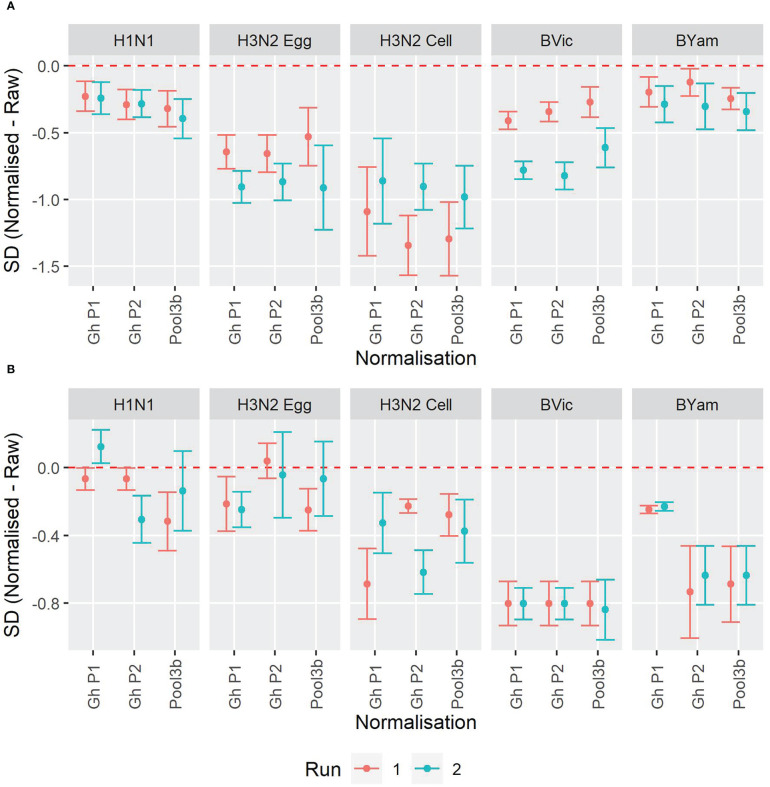
Figure 7.
Impact of normalisation on inter-laboratory agreement for WHO ELISA and FLUCOP 3-5 day MN assays. [7A] WHO ELISA readout: Change in SD when normalisation is applied. [7B] FLUCOP 3-5 day MN: Change in SD when normalisation is applied. Points represent the mean of the per sample pairwise difference of Normalised – Raw with corresponding 95% CI. The red dashed line at 0 indicates no difference.

