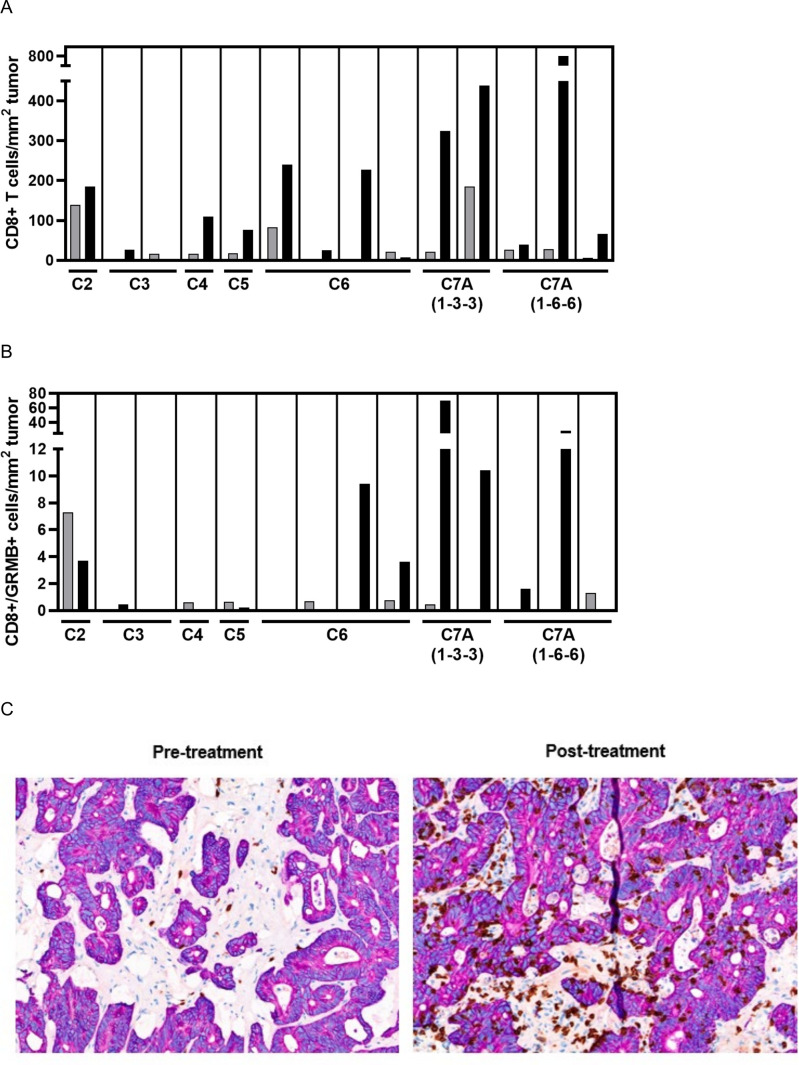
Figure 4.
Post-treatment increases in tumor immune cell infiltration. (A) Intra-tumoral increases in CD8+ T cells in patients with matched pre-treatment (gray bar) and post-treatment (black bar) biopsies from individual patients; (B) increases in CD8+/Granzyme B+ cell density in patients with matched pre-treatment (gray bar) and post-treatment (black bar) biopsies from individual patients; (C) representative immunohistochemistry staining of one lesion (liver) with conversion from “desert” to “inflamed” phenotype (T cells shown in brown).

