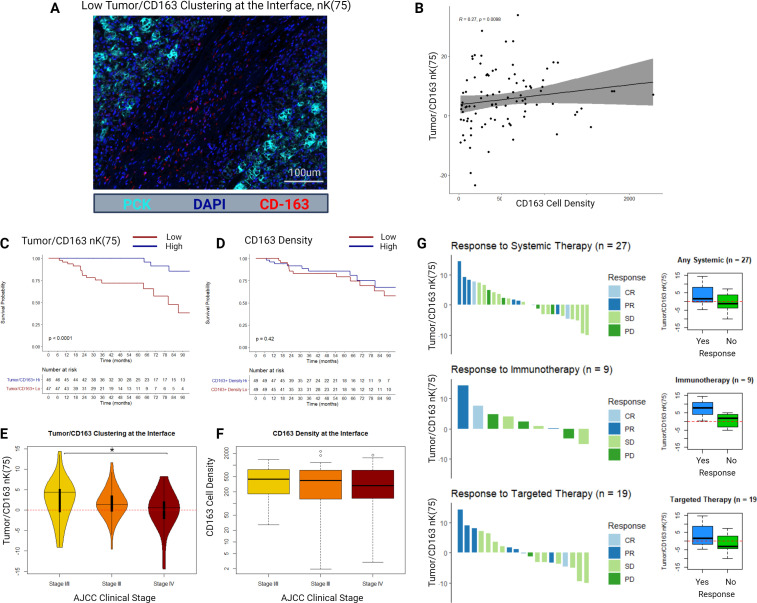
Figure 3.
(A) Example multiplex immunofluorescence image of a sample with low tumor/CD163 nK(75). (B) Scatter plot and Spearman’s correlation between CD163+ cell density and tumor/CD163 nK(75) in the tumor–stroma interface histological zone. (C) Kaplan-Meier distributions for overall survival as stratified by the median value of tumor/CD163 nK(75) in the tumor–stroma interface histological zone. (D) Kaplan-Meier distributions for overall survival as stratified by the median value of CD163+ cell density in the tumor–stroma interface histological zone. (E) Tumor/CD163 nK(75) values stratified by AJCC clinical stage at diagnosis. (F) CD163+ cell density values stratified by AJCC clinical stage at diagnosis. (G) RECIST responses to systemic therapy for a subgroup of patients (n=27), either presenting with or developing clinical stage IV ccRCC, who received either systemic immunotherapy or targeted therapy. Adjacent box-plots demonstrate differences in tumor/CD163 nK(75) stratified by therapy response status. ccRCC = clear cell renal cell carcinoma, AJCC = American Joint Committee on Cancer, RECIST = Response Evaluation Criteria in Solid Tumours, CR = Complete Response, PR = Partial Response, SD = Stable Disease, PD = Progressive Disease.

