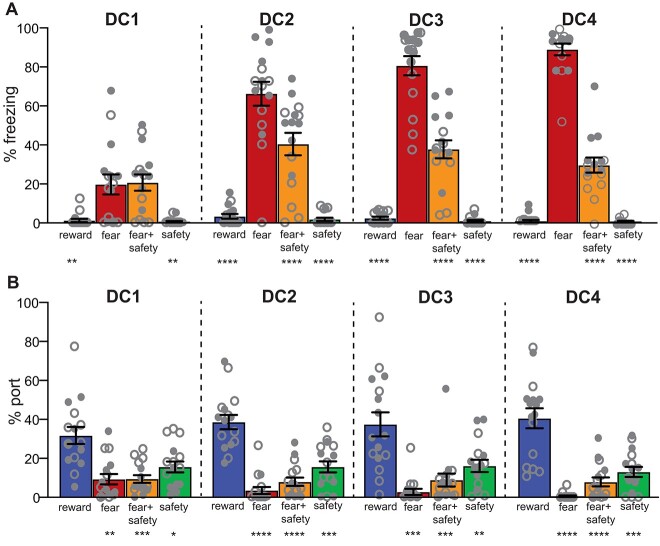
Fig. 2.
Safety-fear-reward discrimination. A) Averaged percentage of time spent freezing during each 20-s cue across the 4 DC sessions. Freezing to the fear cue was significantly higher than all other cues beginning in DC2, indicating good discriminatory fear suppression behavior in the presence of the safety cue. **P < 0.01, ****P < 0.0001 compared to fear cue. B) Averaged percentage of time spent at the port during each 20-s cue across the 4 DC sessions. Reward-seeking to the reward cue was significantly higher than all other cues for all 4 DC sessions, indicating good discriminatory reward-seeking behavior. *P < 0.05, **P < 0.01, ***P < 0.001, ****P < 0.0001 compared to reward cue. Open circles indicate animals trained with an auditory safety cue (n = 7); closed circles indicate animals trained with a visual safety cue (n = 8). Means +/− SEM.

