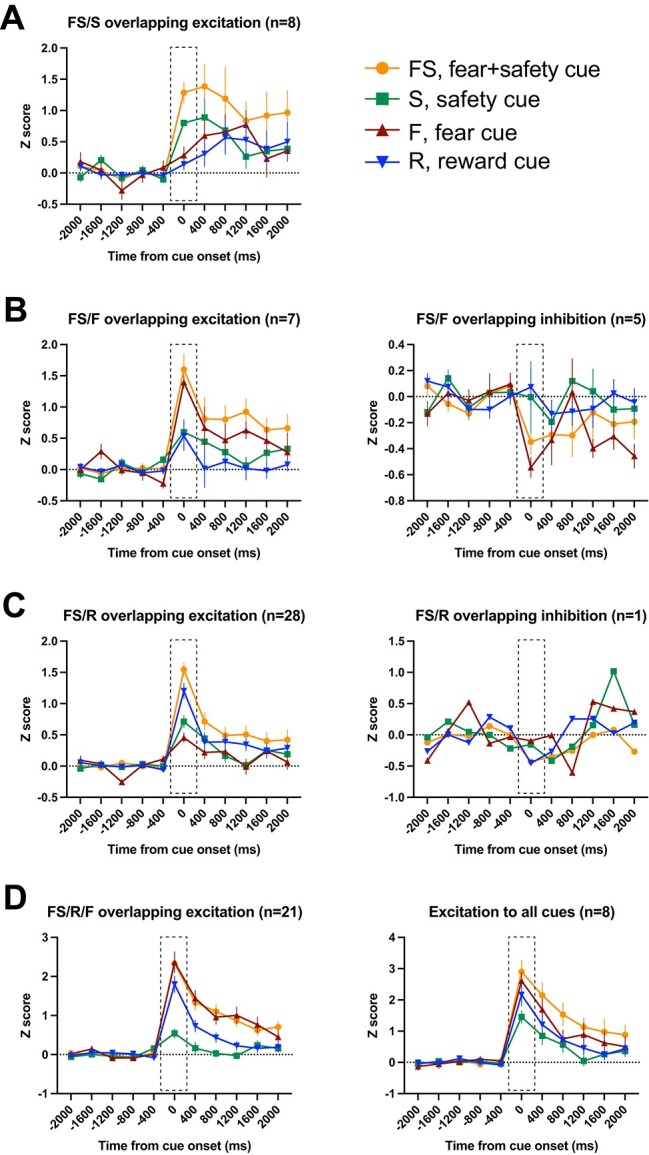
Fig. 5.

Cue-overlapping neurons. Averaged Z-score activity across each subcategory of cue-overlapping neurons. Each of these neurons showed a significant change in activity in the first 400 ms after cue onset compared to 400 ms before cue onset to >1 cue. Activity for the 2 s before and after cue onset are shown as time from cue onset (ms). Between-cue analyses were completed for the time bin 0–400 ms shown in the dashed boxes. A) FS/S overlapping excitation (left). B) FS/F overlapping excitation (left) and inhibition (right). C) FS/R overlapping excitation (left) and inhibition (right). D) FS/R/F overlapping excitation (left) and excitation to all 4 cues (right). Means +/− SEM.
