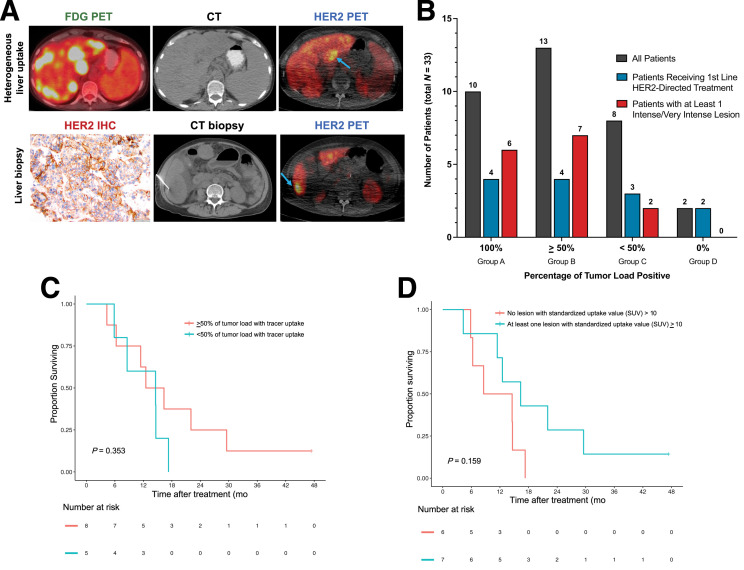
FIGURE 2.
HER2 disease heterogeneity illustrated by 89Zr-trastuzumab PET (HER2 PET). (A) 18F-FDG PET and HER2 PET images from a patient with metastatic HER2+ gastric adenocarcinoma with heterogeneous HER2 expression in the liver. Heterogeneous 89Zr-trastuzumab uptake on imaging is shown (blue arrows demonstrate positive lesions, upper figure). Liver biopsy at a site of 89Zr-trastuzumab uptake demonstrates HER2 positivity with immunohistochemistry 3+ in 60% of cells (lower). (B) The percentage of tumor load with 89Zr-trastuzumab uptake. Patients were stratified into 4 groups by percentage of tumor load showing tracer uptake. Total patients in groups A–D are shown in gray. Number of patients receiving first-line HER2-directed therapy in each group is represented in blue. Patients with at least 1 intense or very intense lesion on HER2 PET (SUV ≥ 10) are represented in red. Of the 15 patients with at least 1 intense or very intense lesion (15/33 [45%]), 6 were in group A (6/33 [18%]) and 7 were in group B (7/33 [21%]). (C) PFS stratified by percentage of tumor load positive in patients receiving first-line HER2-directed therapy (P = 0.353, using permutated log-rank test comparing the 2 groups). (D) PFS stratified by presence of at least 1 lesion with intense or very intense 89Zr-trastuzumab uptake (SUV ≥ 10) in patients receiving first-line HER2-directed therapy (P = 0.159, using permutated log-rank test comparing the 2 groups). IHC = immunohistochemistry.

