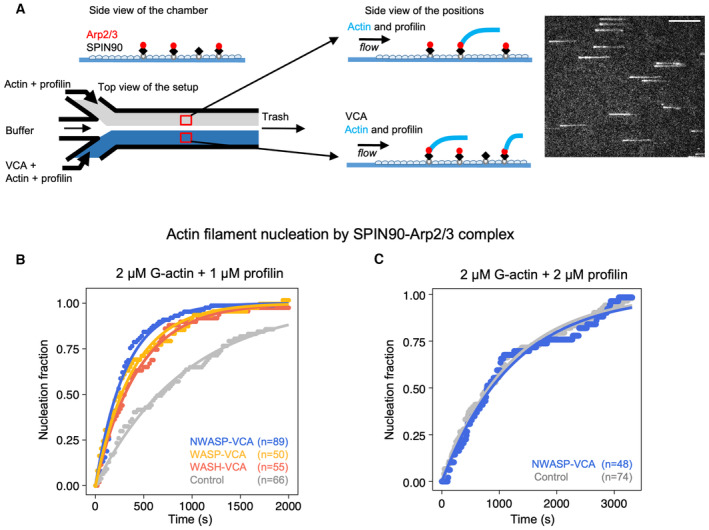
Figure 1. Mammalian VCA motifs accelerate the nucleation of filaments by SPIN90‐Arp2/3.

- Schematic of the nucleation experiment. In a microfluidics chamber, SPIN90 is attached to the coverslip surface via its His‐tag, and exposed to Arp2/3. Half of the chamber is then exposed to actin and profilin, while the other half is exposed to actin, profilin, and VCA. Actin is labeled with Alexa488 (15%), and one can monitor filaments as they nucleate and grow from the surface. Right: TIRF microscopy image of actin filaments. Scale bar: 20 μm.
- Normalized number of filaments nucleated over time, from SPIN90‐Arp2/3 exposed to 2 μΜ G‐actin (15% labeled with Alexa488) and 1 μΜ profilin, with 0 or 0.5 μM of GST‐VCA from different NPFs. Solid lines are exponential fits, yielding nucleation rates knuc = (1.06 ± 0.03) × 10−3 s−1, without VCA, and knuc = (3.23 ± 0.08) × 10−3, (2.58 ± 0.05) × 10−3, and (2.28 ± 0.03) × 10−3 s−1 with VCA from N‐WASP, WASP, and WASH, respectively.
- Same as in (B), with 2 μM G‐actin and 2 μM profilin. The exponential fits yield knuc = (8.5 ± 0.1) × 10−4 s−1 without VCA, and knuc = (8.0 ± 0.2) × 10−4 s−1 with 0.5 μM GST‐VCA from N‐WASP.
Data information: In (B, C), indicated values of n are the number of filaments observed in each individual experiment. These experiments were repeated three times, with similar numbers of filaments in each experiment, yielding similar results.
Source data are available online for this figure.
