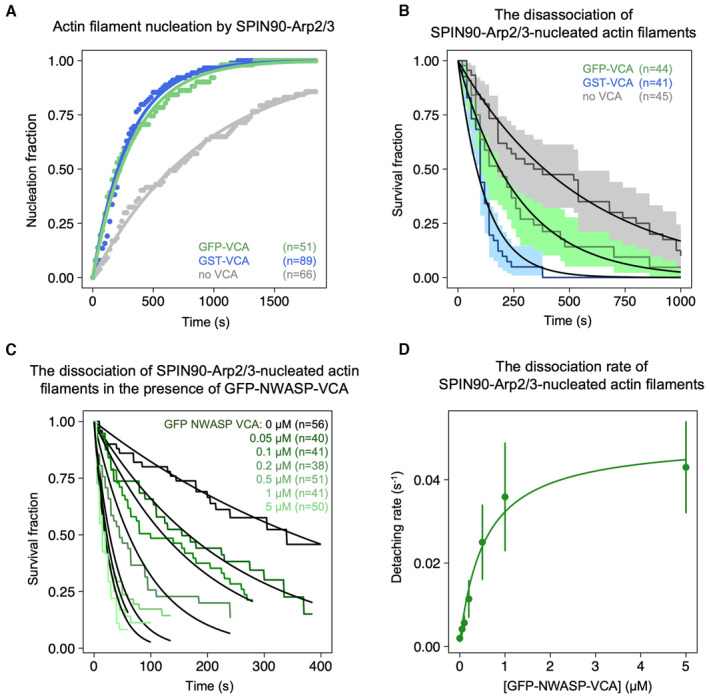
Normalized number of filaments nucleated over time, from SPIN90‐Arp2/3 exposed to 2 μΜ G‐actin (15% labeled with Alexa488) and 1 μΜ profilin, with 0 or 0.5 μM of GST‐N‐WASP‐VCA or GFP‐N‐WASP‐VCA. Solid lines are exponential fits, yielding nucleation rates knuc = (1.06 ± 0.03) × 10−3 s−1 without VCA, and knuc = (3.23 ± 0.08) × 10−3 s−1 and (3.02 ± 0.04) × 10−3 s−1 with GST‐N‐WASP‐VCA and GFP‐N‐WASP‐VCA, respectively. Indicated values of n are the number of filaments observed in each experiment. These experiments were repeated three times, with similar results.
Detachment of SPIN90‐Arp2/3‐nucleated filaments during the nucleation experiment shown in panel A. Solid lines are exponential fits, yielding dissociation rates koff = (1.8 ± 0.6) × 10−3 s−1 without VCA, and koff = (7.9 ± 1.9) × 10−3 s−1 and (3.7 ± 1.4) × 10−3 s−1 with GST‐N‐WASP‐VCA and with GFP‐N‐WASP‐VCA, respectively. Indicated values of N are the number of filaments observed in each experiment.
The fraction of filaments still attached to the surface, versus time, for different concentrations of GFP‐NWASP‐VCA. Black lines are exponential fits. Indicated values of n are the number of filaments observed in each experiment. Each experiment was repeated twice (technical replicates), yielding similar results.
Detachment rates determined by exponential fits of survival curves (in C) as a function of the concentration of VCA motifs from different NPFs. The error bars result from fits of the 95% confidence interval in the survival curves. The data are fitted by a Michaelis–Menten equation, resulting in KD = 0.56 ± 0.11 μM and Vmax = 0.049 ± 0.0034 s−1.

