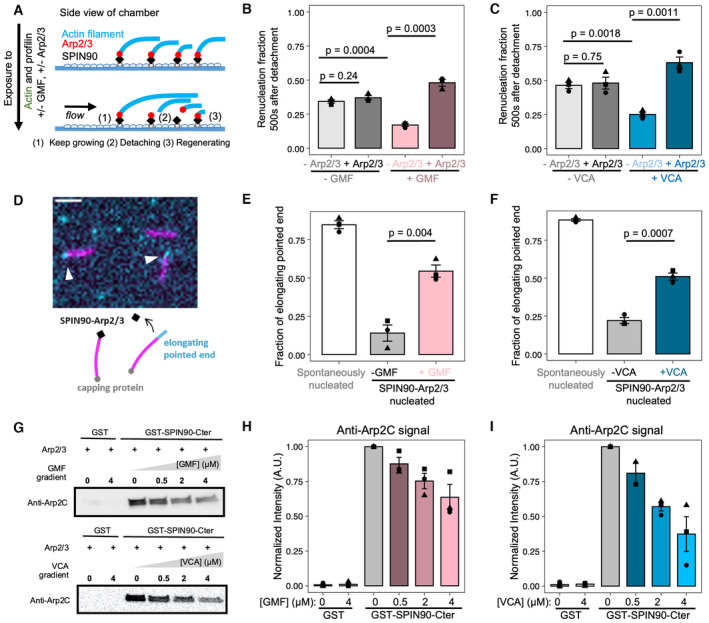
Figure 4. GMF and VCA accelerate the detachment of Arp2/3 from both SPIN90 and filament pointed ends.

-
A–CAssessing the presence of Arp2/3 on SPIN90 after filament departure. (A) Schematic of the renucleation assay, using microfluidics. The SPIN90‐Arp2/3 complex‐decorated surface is exposed to 2 μΜ Alexa488 (15%)‐G‐actin and 1 μΜ profilin, with 0 or 0.5 μΜ GMF, and with 0 or 5 nM Arp2/3. Filaments nucleated by SPIN90‐Arp2/3 elongate (1) and, over time, detach from the surface (2). Some of them re‐nucleate, from the same location (3). (B, C) The fraction of SPIN90 that re‐nucleated a filament 500 s after the detachment of the initial filament was quantified for different conditions.
-
D–FAssessing the presence of Arp2/3 at the filament pointed end. (D) Schematic and microscope image of the pointed end uncapping assay. Preformed filaments made with Alexa488 (15%)‐actin (magenta) were mixed with 10 nM Capping protein, 1 μΜ Alexa568 (15%)‐G‐actin (cyan), and 0 or 0.5 μΜ GMF (or 0.5 μM VCA). In the microscope image, filaments were nucleated by SPIN90‐Arp2/3, and exposed to 0.5 μM GMF. Slow elongation of the filaments at one end (white arrowheads) indicates freely growing pointed ends. Scale bar: 3 μm. (E, F) The fraction of elongating, that is, not capped, pointed ends was determined for different conditions.
-
G–IGMF and VCA interfere with the SPIN90‐Arp2/3 interaction in the absence of filament. (G) Immunoblots from pull‐down assays where GST beads, decorated with GST or GST‐SPIN90‐Cter (the functional domain of SPIN90), were incubated with 0.4 μΜ Arp2/3 and gradient concentrations of GMF or VCA for 1 h at room temperature. After the unbound protein was washed out, the amount of Arp2/3 attached to the beads was detected by anti‐ArpC2 antibody. Ponceau red straining of the membrane verified that the beads were loaded with equal amounts of GST or GST‐SPIN90 (Appendix Fig S2). (H, I) Quantification of the amount of ArpC2 remaining on the beads in different conditions.
Data information: In all graphs (B, C, E, F, H and I): the bars indicate the average values, and the error bars indicate the standard deviations, from three independent repeats of each experiment (data points). For each condition (in B, C, E and F), a total of n = 70–152 filaments were analyzed (see Source Data for individual values of n). The P‐values (in B, C, E and F) were determined with an unpaired t‐test.
Source data are available online for this figure.
