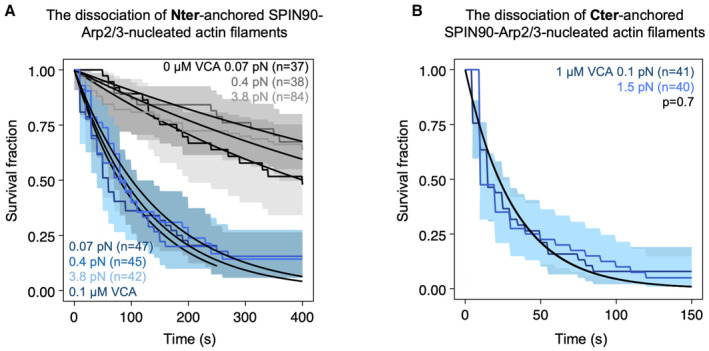
Figure EV4. Anchoring SPIN90 by its C‐ or N‐terminus has no impact on its behavior.

- Survival fractions for SPIN90‐Arp2/3‐nucleated filaments exposed to different forces in the microfluidics chamber, while being exposed to 0.15 μM G‐actin alone or with 0.1 μΜ GFP‐VCA. In this case, SPIN90 was anchored on the surface through its Nter‐GST‐tag. Black lines are exponential fits, yielding dissociation rates at 0.07 pN force, koff = (1.6 ± 0.6) × 10−3 s−1 without VCA, and koff = (7.5 ± 3.3) × 10−3 s−1 with 0.1 μΜ VCA; at 0.4 pN force, koff = (1.2 ± 0.5) × 10−3 s−1 without VCA, and koff = (7.4 ± 3.5) × 10−3 s−1 with 0.1 μΜ VCA; 3.8 pN, koff = (1.3 ± 0.4) × 10−3 s−1 without VCA, and koff = (6.9 ± 2.4) × 10−3 s−1 with 0.1 μΜ VCA. The shaded areas represent 95% confidence intervals.
- Survival fractions for SPIN90‐Arp2/3‐nucleated filaments exposed to 1 μM VCA. In this case, SPIN90 was anchored on the surface through its Cter‐His‐tag. Black lines are exponential fits, yielding dissociation rates koff = (3.1 ± 1.5) × 10−2 s−1 at 0.1 pN force and koff = (3.1 ± 1.3) × 10−2 s−1 at 1.5 pN force. The shaded areas represent 95% confidence intervals.
