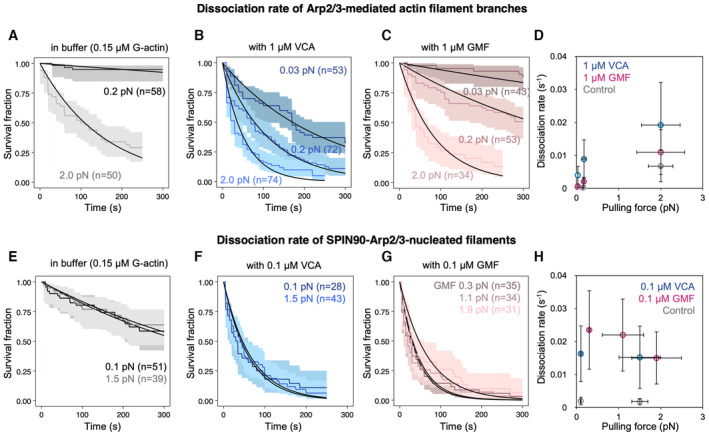
Figure 5. Impact of mechanical tension on debranching and on the detachment of SPIN90‐Arp2/3‐nucleated filaments.

-
A–CSurvival fractions for branches exposed to different forces in the microfluidics chamber, while being exposed to 0.15 μM G‐actin, alone (gray curves, A), with 1 μM VCA (blue curves, B), or with 1 μM GMF (red curves, C). The shaded areas represent 95% confidence intervals. Black lines are exponential fits.
-
DSummary of the debranching rates, resulting from the exponential fits in (A–C).
-
E–GSurvival fractions for SPIN90‐Arp2/3‐nucleated filaments exposed to different forces in the microfluidics chamber, while being exposed to 0.15 μM G‐actin, alone (gray curves, E), with 0.1 μM VCA (blue curves, F), or with 0.1 μM GMF (red curves, G). The shaded areas represent 95% confidence intervals. Black lines are exponential fits.
-
HSummary of the detachment rates for SPIN90‐Arp2/3‐nucleated filaments, resulting from the exponential fits in (E–G).
Data information: Each curve in (A–C, E–G) is from a single experiment. Each experiment was repeated twice (technical replicates), yielding similar results. The results in (E, F) were confirmed by additional experiments on linear filaments, with a different anchoring strategy for SPIN90 and with a higher VCA concentration (Fig EV4). In (D, H), horizontal error bars are SD of applied forces, and vertical error bars result from fits of the 95% confidence interval in the survival fractions.
Source data are available online for this figure.
