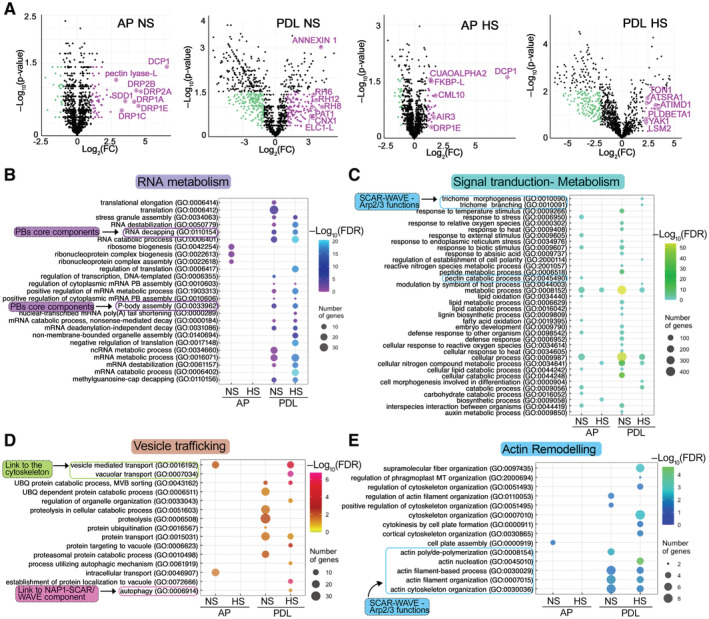
Figure 2. APEAL captured the PB proteome and proxitome.

-
AVolcano plots showing significantly enriched proteins in NS and HS conditions from the AP and PDL APEAL steps. Selected proteins are indicated in magenta and are encoded by genes that belong to the identified subnetworks described in (C) and (D). Magenta indicates enrichment in HS samples; cyan indicates depletion in HS samples.
-
B–EGene Ontology (GO) enrichment analyses of the APEAL results, divided into four subnetworks. Note the terms related to vesicle trafficking and actin remodeling. A more detailed description is provided in Fig EV5 and in the Appendix text. Note that signal transduction proteins, metabolism‐related proteins, and vesicle trafficking proteins evade PBs during HS (Fig EV5, reduced hit number), while the opposite pattern is observed for actin and RNA metabolism subnetworks. FDR, false discovery rate. Important links described below are indicated (i.e., to the SCAR–WAVE/ARP2–ARP3 (and the component NAP1 which is part of the SCAR–WAVE and links to autophagy), cytoskeleton, PB core, and cell‐wall‐related metabolism).
Source data are available online for this figure.
