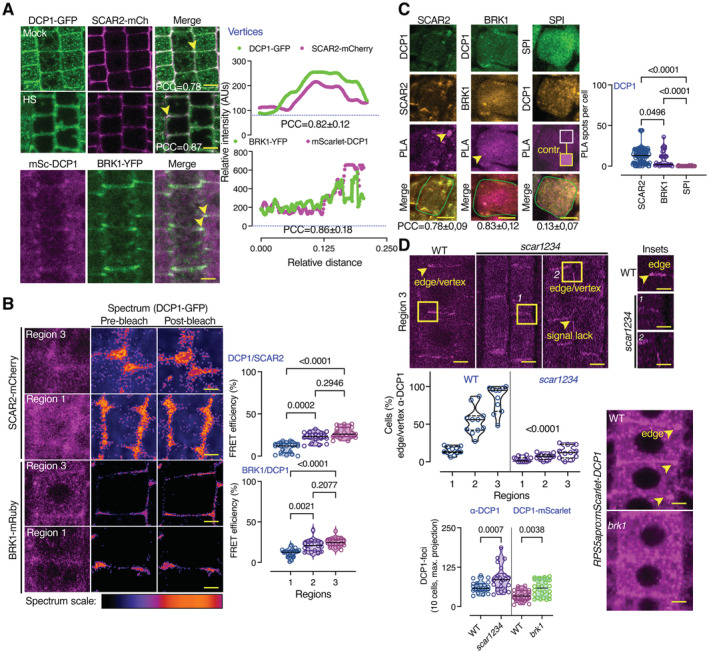
Figure 6. DCP1 cooperates with the SCAR–WAVE complex.

- DCP1 colocalizes with the SCAR–WAVE components SCAR2 and BRK1. Representative confocal micrographs showing colocalization between DCP1 and SCAR2 or DCP1 and BRK1 (in lines coexpressing DCP1pro:DCP1‐GFP and SCAR2pro:SCAR2‐mCherry or RPS5apro:HF‐mScarlet‐DCP1 and BRK1pro:BRK1‐YFP; arrowheads indicate colocalization at cell edges or vertices) in root epidermal cells (regions 2–3). Right: relative signal intensity profiles of DCP1 or SCAR2 at vertices. Colocalization at these regions was also calculated (PCC; N, biological replicates = 2, n = 4–10 edges/vertices in regions 2–3; a slight increase was observed in HS, 0.78 in NS vs. 0.87 in HS). Scale bars: 10 μm.
- Representative confocal micrographs with acceptor photobleaching‐FRET efficiency between SCAR2‐mCherry (up) or BRK1‐mRuby (down) and DCP1‐GFP (epidermal cells, regions 1 and 3). Right: normalized FRET efficiency between SCAR2 or BRK1 and DCP1, respectively, among the different developmental root regions (N, biological replicates = 2, n = 16 cells). Scale bars: 3 μm.
- Representative confocal micrographs showing PLA spots produced by α‐GFP/α‐RFP in DCP1‐GFP/SCAR2‐mCherry lines and DCP1‐GFP/BRK1‐mRuby lines, α‐FLAG/α‐GFP in HF‐mScarlet‐DCP1/SPI‐YPet (SPIRRIG [SPI] is a negative control as it localizes to PBs only during salt stress and was not found in the APEAL). In the SPI PLA, a high contrast inset is presented. Right: number of PLA spots per cell (N, biological replicates = 3, n (pooled data of 3 biological replicates) = 14–33 cells). In the merged images, the cell contours are shown (light green transparent). Scale bars: 5 μm.
- Representative confocal micrographs showing DCP1 localization detected by α‐DCP1 in the wild type (WT) or the scar1 scar2 scar3 scar4 (scar1234) quadruple mutant or in live‐cell imaging of mScarlet‐DCP1 (RPS5apro:HF‐mScarlet‐DCP1) in WT or brk1 mutant (bottom right; epidermal cells, region 3 for α‐DCP1 and 2 for live‐cell imaging). The arrowheads denote the lack of robust DCP1 localization in scar1234 at the edge/vertex. Small panels (insets) at right show details corresponding to the regions delineated by dashed lines, where arrowhead denotes the edge signal of DCP1 in WT; scale bars, 1 μm. Bottom: percentage of cells with proper edge/vertex localization and quantification of PB numbers (DCP1‐foci; N, biological replicates = 3, n (pooled data of 3 biological replicates) = 18–35 cells). Scale bars, 5 μm.
Data information: In (B), P values were determined by Kruskal–Wallis, and the comparisons are among the scar1234 to the corresponding WT samples. In (C and D), P values were determined by Wilcoxon. PCCs are means ± s.d. Upper and lower lines in the violin plots when visible, represent the first and third quantiles, respectively, horizontal lines mark the median and whiskers mark the highest and lowest values.
Source data are available online for this figure.
