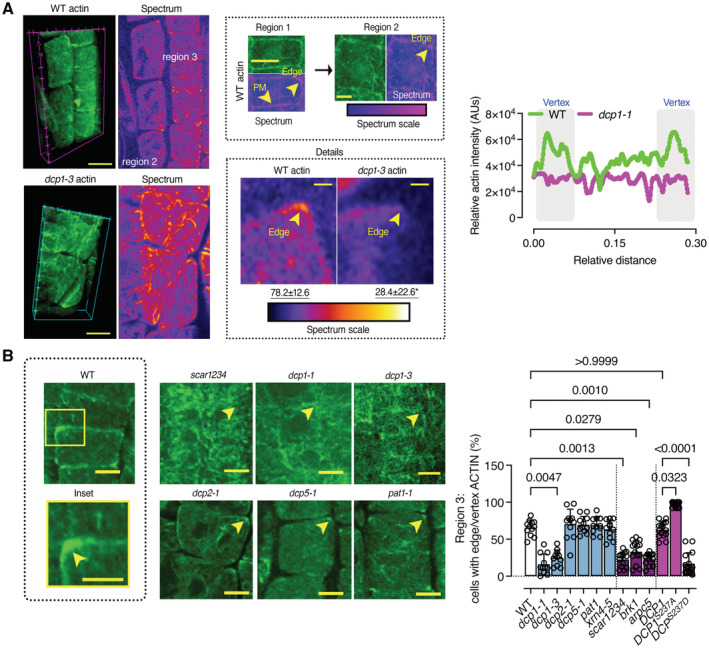
Figure 8. DCP1 Phosphostatus regulates Actin remodeling at the edge.

- Representative confocal 3D rendering micrographs of root meristematic cells from the WT or the dcp1‐3 mutant stained with phalloidin for actin visualization (N, biological replicates = 3, n = 4). Scale bars: 5 μm (z‐scale is 4 μm). Upper middle: the “Spectrum” micrographs indicate the maximum color‐coded signal intensity (scale on the right, middle inset). Note that the signal is evenly distributed in region 1 (left upper micrograph), whereas it mostly accumulates at the edge or vertex in regions 2 and 3 (see arrowheads; images on top). Lower middle: a detail of the higher actin accumulation at edges/vertices in region 2 (compare regions 1 and 2, Scale bars: 7 μm). Insets (details, Scale bars: 2 μm) indicate the loss of vertex actin accumulation in dcp1‐3. Right: plot profile from the actin signal in the WT or dcp1‐3. The vertices are indicated.
- Representative confocal micrographs showing actin localization in WT, dcp1‐1, dcp1‐3, scar1234, dcp2‐1, dcp5, and pat1 upon phalloidin staining and graph (right) indicating the percentage of cells in region 3 with an accumulation of actin at edges in various genotypes (N, biological replicates = 3, n = 7–9 roots, bars show means + s.d.). Scale bars: 7 μm.
Data information: In A, P values were determined by Kruskal–Wallis, while in (B), the exact P values were determined by Brown–Forsythe and Welch ANOVA.
Source data are available online for this figure.
