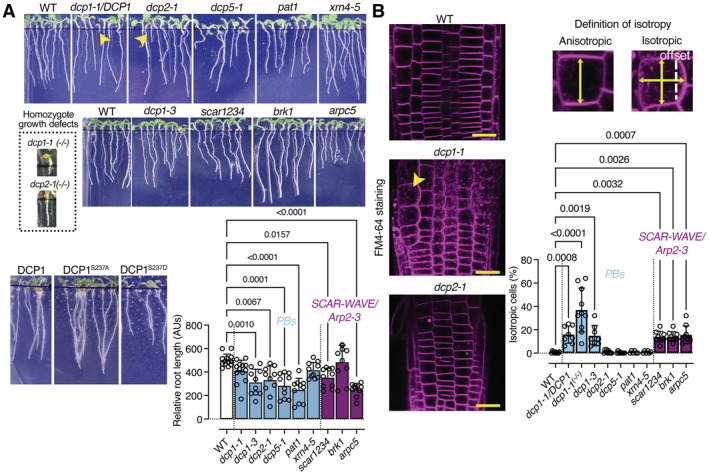
Figure 10. The SCAR–WAVE‐DCP1 nexus at the vertex can modulate growth anisotropy.

- Representative images showing the phenotypes of dcp1 mutants and mutants in other PB core components or SCAR–WAVE components (5‐day‐old seedlings). The arrowheads show the growth defects of homozygous dcp1‐1 or dcp2‐1 mutants (denoted −/−; heterozygous denoted dcp1‐1/DCP1; details are also shown). Lower: graph showing relative root length (N, biological replicates = 3, n (pooled data of 3 biological replicates) = 3–4 roots, bars show means + s.d).
- DCP1 regulates cell expansion anisotropy. Representative confocal micrographs showing FM4‐64 staining of the WT, dcp1‐1 and dcp2‐1 mutants (2 μM, 10 min). Scale bars, 20 μm. Right: percentage of isotropic cells per root meristem (%, epidermal cells) in each genotype (N, biological replicates = 3, n (pooled data of 3 biological replicates) = 3–5 roots, bars show means ± s.d). Examples of isotropic or anisotropic cells are shown, along with the developmental axis offset at the x‐ and y‐axes.
Data information: In (A and B), P values were determined by ordinary one‐way ANOVA (Kruskal–Wallis produced similar results, with Dunn's or FDR corrections).
Source data are available online for this figure.
