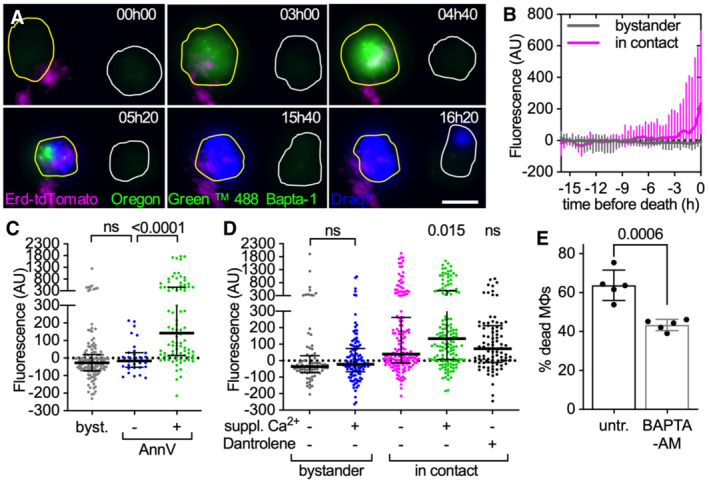
Figure 4. Extracellular Mtb aggregates induce cytosolic calcium accumulation in cytochalasin D‐treated macrophages.

-
A–DCytochalasin D‐treated BMDMs were stained with the membrane‐permeable dye Oregon Green 488 Bapta‐1 AM to visualize intracellular Ca2+, infected with aggregates of Mtb Erdman WT and imaged by time‐lapse microscopy at 20‐min intervals for 24 h. Oregon Green 488 Bapta‐1 AM fluorescence values at each time point were normalized to time 0 for uninfected bystander cells and to the time of first contact with an Mtb aggregate for infected cells. In (C, D) values for infected cells correspond to the time of death after first contact or 16 h post‐contact for cells that survive. Values for uninfected bystander cells correspond to the time of death or 16 h. Each symbol represents a single macrophage. Black bars represent the median and interquartile range. (A) Examples of BMDMs dying with (yellow outline) or without (white outline) interacting with extracellular Mtb aggregates. Cell outlines are based on brightfield images (see Movie EV9). Cell death is indicated by Draq7 nuclear staining. Scale bar, 10 μm. (B) Oregon Green 488 Bapta‐1 AM fluorescence over time in dying bystander macrophages (n = 15) and in dying macrophages in contact with an Mtb aggregate (n = 63). Lines represent median fluorescence values for all cells, error bars represent interquartile ranges. The distributions of the fluorescence values at the time of death in bystander and dying macrophages are significantly different, P‐value < 0.0001, calculated using a Welch's t‐test. (C) Oregon Green 488 Bapta‐1 AM fluorescence for uninfected bystander cells (byst.; n = 137) and for infected cells with (+; n = 91) or without (−; n = 32) Annexin V‐positive plasma membrane domains at the site of contact with an Mtb aggregate. P‐values were calculated using a Krustal–Wallis test; ns, P‐values > 0.05. (D) Oregon Green 488 Bapta‐1 AM fluorescence in bystander and infected macrophages incubated in medium with or without 10 mM Ca2+ and dantrolene. Lines represent median fluorescence values for all cells, error bars represent interquartile ranges. P‐values for bystander cells were calculated using an unpaired Mann–Whitney test. P‐values for infected cells were calculated using a Krustal–Wallis test comparing the treated samples to the untreated control; ns, P‐values > 0.05. (n = 81, 122, 165, 152, and 94, respectively, n represents the number of individual cells analyzed per condition; pooled values from ≥2 biological replicates).
-
EBMDMs treated with cytochalasin D were infected with aggregates of Mtb Erd‐tdTomato and imaged by time‐lapse microscopy at 1‐h intervals for 60 h. Percentage of macrophages that die within the first 12 h after stable contact with an Mtb aggregate without (untr.) or with supplementation of BAPTA‐AM. Each symbol represents the percentage of dead macrophages for a single biological replicate (n ≥ 60 cells per replicate). Bars represent means and standard deviations, P‐value calculated using a t‐test.
Source data are available online for this figure.
