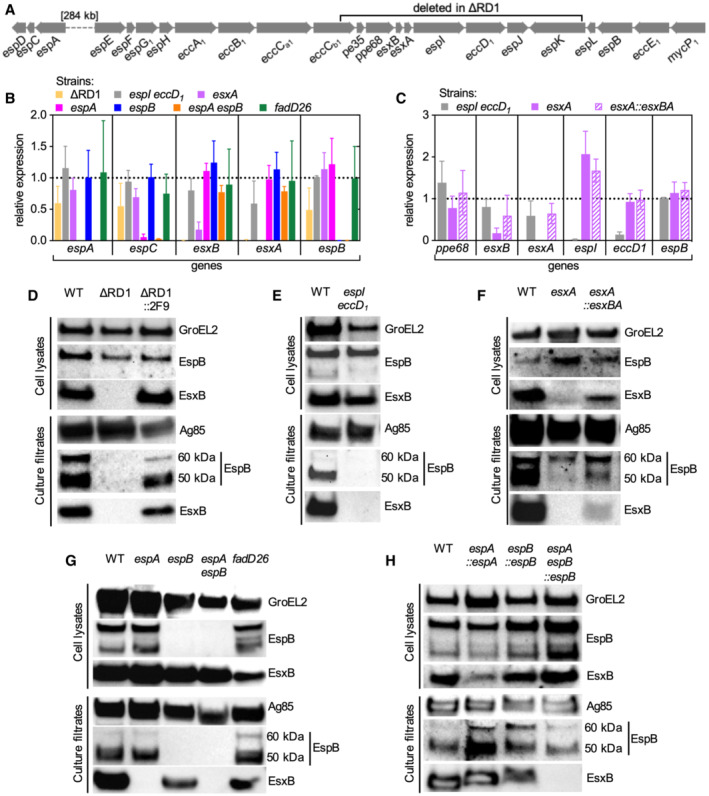
Figure EV4. Expression and secretion patterns of ESX‐1 proteins in the different mutant strains used in this study.

-
ARepresentation of the espACD and esx‐1 loci in the Mtb genome.
-
B, CExpression levels of selected genes of the espACD and esx‐1 loci in different mutants. Relative expression (fold changes) was normalized to the WT strain (WT expression = 1, indicated by the dotted line). Bars represent mean values (n = 3 biological replicates) and error bars represent standard deviation.
-
D–HRepresentative immunoblots of cell lysates and culture filtrates from different Mtb strains were probed with the indicated antibodies. In culture filtrates EspB shows a full‐length 60‐kDa isoform and a truncated 50‐kDa isoform as previously reported (Ohol et al, 2010; Chen et al, 2013a, 2013b). GroEL2 and Ag85 were respectively used as loading controls for cell lysates and culture filtrates.
