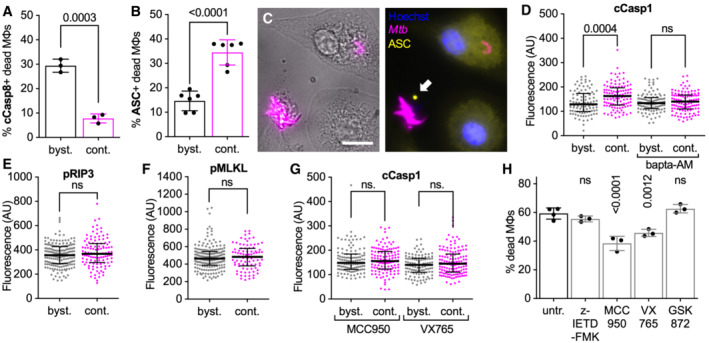
Figure 5. Extracellular Mtb aggregates induce inflammasome activation and pyroptosis in cytochalasin D‐treated macrophages.

-
A–GBMDMs treated with cytochalasin D were infected with aggregates of Mtb Erd‐tdTomato, fixed at 24 h post‐infection, and processed for immunofluorescence with antibodies targeting cellular markers for cell death pathways. Controls and representative microscopy images for all the antibodies used are provided in Appendix Fig S9. Macrophages are defined as “in contact” when the body of a macrophage identified in brightfield images overlaps with a bacterial aggregate identified in the fluorescence channel (see Appendix Fig S9 for representative examples). (A) Percentage of dead uninfected bystander macrophages (byst.) or dead macrophages in contact (cont.) with an extracellular Mtb aggregate that stains positive for cleaved Caspase‐8 (cCasp8). Each symbol represents the percentage of positive dead macrophages for a single biological replicate (n ≥ 50 cells per replicate). Bars represent means and standard deviations. P‐values were calculated using a t‐test. (B) Percentage of dead uninfected bystander macrophages (byst.) or dead macrophages in contact with an extracellular Mtb aggregate (cont.) that display ASC‐specks. Each symbol represents the percentage of positive dead macrophages for a single biological replicate (n ≥ 80 cells per replicate). Bars represent means and standard deviations. P‐values were calculated using a t‐test. (C) Representative example of a dead macrophage in contact with an extracellular Mtb aggregate that displays a ASC‐speck (white arrow). Nuclei stained with Hoechst. Scale bar, 10 μm.(D–G) Median fluorescence values for bystander macrophages (byst.) or macrophages in contact with an extracellular Mtb aggregate (cont.) stained with an (D, G) anti‐cleaved Caspase‐1 antibody (cCasp1), an (E) anti‐phosphorylated RIP3 antibody (pRIP3), or (F) anti‐phosphorylated MLKL antibody (pMLKL). In (D) BMDMs were untreated or incubated with Bapta‐AM during the course of the infection. In (G) BMDMs were treated with MCC950 (NLRP3 inhibitor) or with VX765 (Caspase‐1 inhibitor) during the course of the infection. Each symbol represents a single macrophage. Black bars represent the median and interquartile range. P‐values were calculated using an unpaired Mann–Whitney test; ns, P‐values > 0.05. (D: n = 93, 108, 101, and 115, respectively; E: n = 182 and 112, respectively; F: n = 186 and 84, respectively; G: n = 117, 121, 111, and 129, respectively; and n represents the number of individual cells analyzed per condition).
-
HBMDMs treated with cytochalasin D were infected with aggregates of Mtb and imaged by time‐lapse microscopy at 1‐h intervals for 60 h. Percentage of macrophages that die within the first 12 h after stable contact with an Mtb aggregate. Macrophages were treated with the apoptosis inhibitor Z‐IETD‐FMK (Caspase‐8 inhibitor); with pyroptosis inhibitors MCC950 (NLRP3 inhibitor) or VX765 (Caspase‐1 inhibitor); or with necroptosis inhibitor GSK872 (RIP3 inhibitor). Each symbol represents the percentage of dead macrophages for a single biological replicate (n ≥ 95 cells per replicate). Bars represent means and standard deviations. P‐values were calculated using a one‐way ANOVA test comparing treated samples with the untreated control; ns, P‐values > 0.05.
Source data are available online for this figure.
