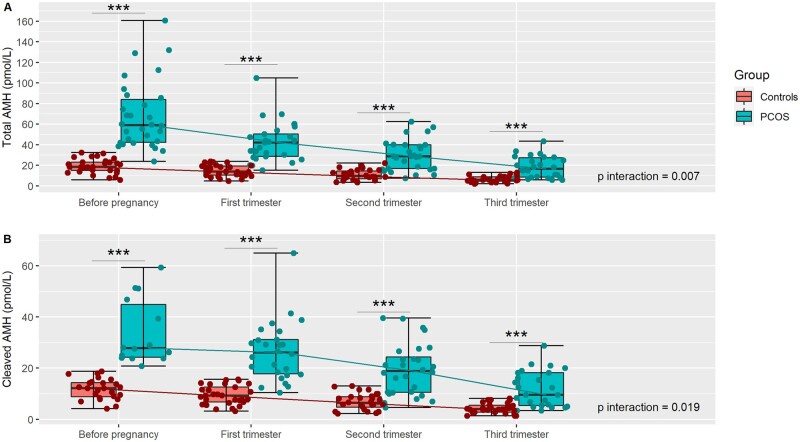
Figure 2.
Individual evolution of molecular forms of AMH throughout pregnancy in women with PCOS and controls. (A) Total AMH (pmol/l); (B) cleaved AMP (pmol/l) = (total AMH − pro AMH). Each plot in red (controls) or in green (PCOS) represent an individual measurement of AMH. For each time of the follow-up, median, Q1, Q3, minimum, and maximum are presented. PCOS: polycystic ovary syndrome; ***P < 0.001; P interaction: comparison of the evolution of hormones levels between women with PCOS and controls.

