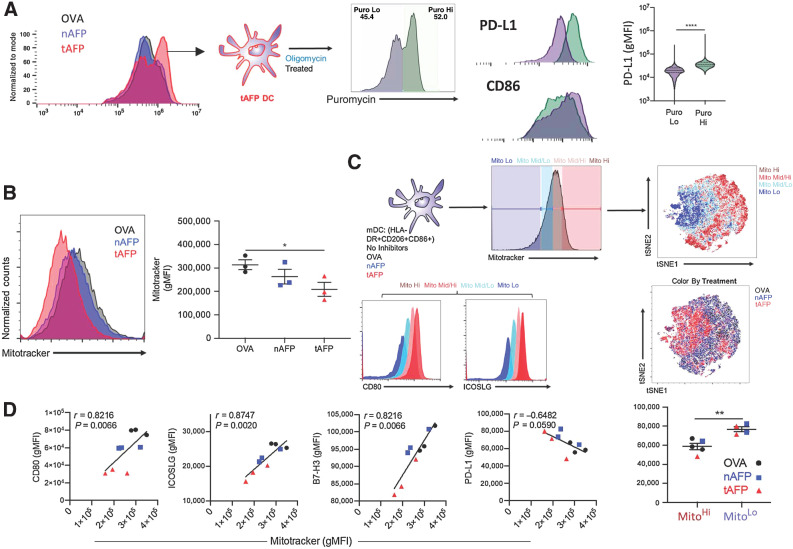
Figure 2.
Mitochondria expression correlates with costimulatory molecule expression. A, Shown are puromycin histograms (a measurement of translation and a surrogate for ATP production) for OVA (black), nAFP (blue), or tAFP (red)-treated DCs. tAFP-treated DCs treated with oligomycin were separated into puromycin low (purple) and high (green). The expression levels of PD-L1 and CD86 are shown in the puromycin low and high DCs. B, Mitochondrial size, as measured by MitoTracker was determined in OVA, nAFP, and tAFP-treated DCs. C, mDCs treated with OVA, nAFP, or tAFP were characterized by mitochondrial size with high (dark red), mid/high (pink), mid/low (teal), and low (dark blue), and clustered on the basis of immune parameters by tSNE colored by mitochondrial size or treatment condition. Shown are the expression levels of CD80 and ICOSLG based on mitochondrial size. D, Correlations between MitoTracker and CD80, ICOSLG, B7-H3, and PD-L1 are shown. Differences in PD-L1 expression levels are shown between Mito hi and Mito lo cells color coded by treatment condition. All data are from one donor performed in 3 technical replicates. *, P ≤ 0.05; **, P ≤ 0.01; ****, P ≤ 0.0001.

