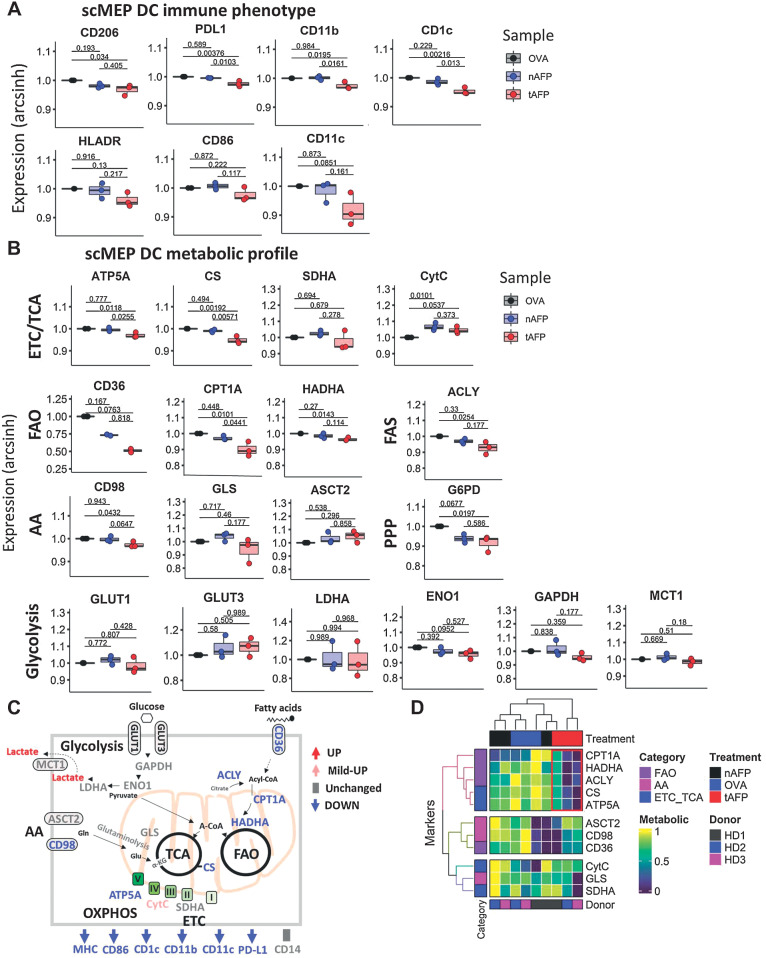
Figure 3.
Immune and metabolic profile by scMEP. A and B, mDC were generated in vitro in the presence of OVA, nAFP, and tAFP and analysis of the immune-metabolic profile was determined by scMEP using CyTOF. Shown are the arcsinh-transformed values for immune response–related molecules (A) and metabolic pathway proteins (B). C, A schematic is shown to summarize the tAFP-induced immune-metabolic changes. D, A heatmap of various metabolic markers was generated and hierarchical clustering was performed on the basis of marker expression and treatment condition. The red box indicates the unique clustering of the tAFP-treated cells. Data are representative of three separate healthy donors, each performed in a single replicate.

