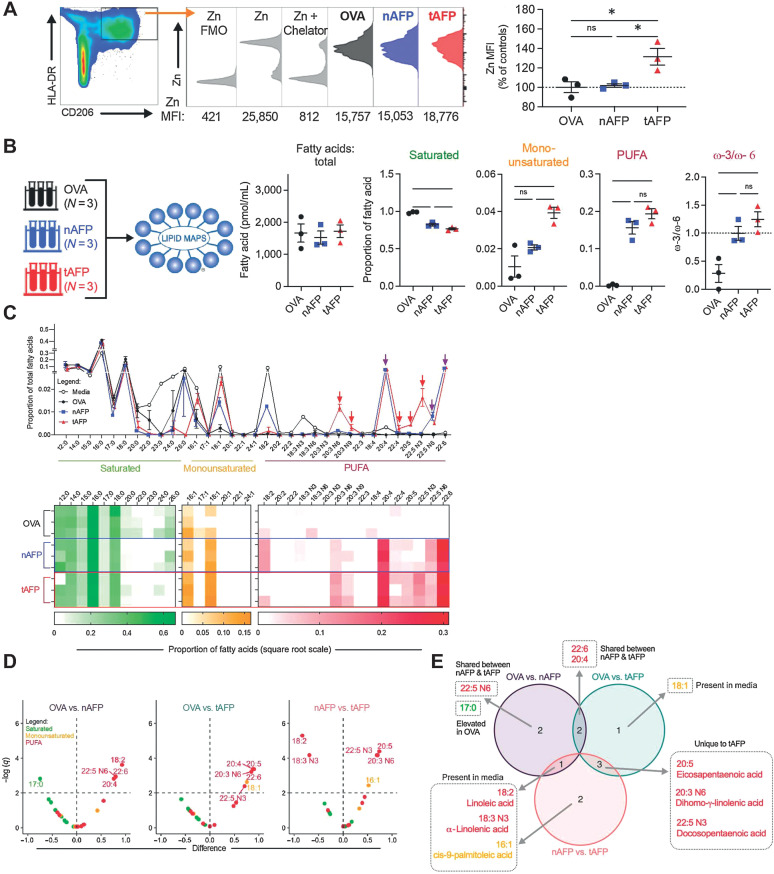
Figure 5.
tAFP bound lipids are enriched for PUFAs. A, Levels of zinc were quantified in iDCs treated with OVA (black), nAFP (blue) or tAFP (red) in three technical replicates from a single donor and are shown as histograms as well as Zn MFIs (percentage of controls). B, Shown are the total mass of all bound fatty acids and the proportion that are saturated, monounsaturated, and polyunsaturated (PUFA) fatty acids. C, Displayed are the proportions of individual fatty acids present in CellGenix DC media, OVA, nAFP, or tAFP. Shown is a heatmap of the proportion of individual fatty acids bound to each protein. D, Volcano plots were generated on the basis of each protein compared with each other protein and color-coded on the basis of the class of fatty acid: saturated (green), monounsaturated (yellow), and PUFA (red). The horizontal dashed line indicates the significance threshold based on an FDR of 1%. E, A Euler diagram demonstrates the various combinations of differentially bound fatty acids (from C), indicating that they are present in the media and are unique or shared amongst the proteins. Error bars are based on mean ± SD. Statistical differences in the mass or proportion of saturated, monounsaturated, or polyunsaturated fatty acids were determined on the basis of a one-way ANOVA with Tukey multiple comparison test. Volcano plots were generated based upon unpaired t tests using a single pooled variance; multiple comparisons were accounted for using an FDR of 1% via a two-stage step-up. ns, nonsignificant; *, P ≤ 0.05.

