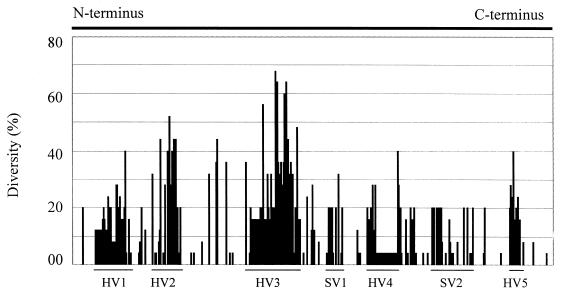
FIG. 3.
Quantitative measurement of sequence variation in each aa position in MOMP. The percent diversity is calculated using the PsFind program(29) from the aligned sequences in Fig. 2. The N-terminal 22 amino acids and the C-terminal 24 amino acids in the alignment are omitted from the calculation because of the unavailability of the terminal sequences in some strains. The arbitrarily designated hypervariable (HV) and semivariable (SV) regions are marked by lines. The variable regions correspond to the predicted external loops L1, L2, L4, L5, L6, L7, and L8, respectively.

