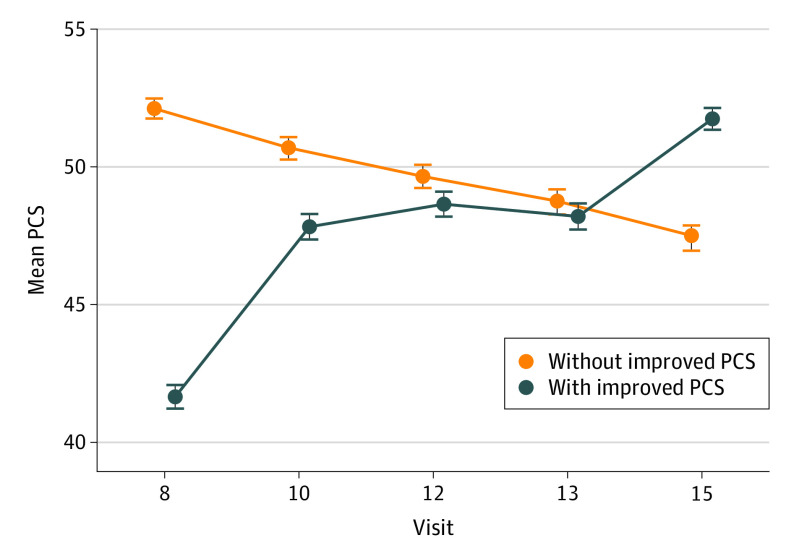
Figure 2. Mean Physical Component Score (PCS) at Each Time Point Stratified by Women With Improved PCS vs Women Without Improved PCS.
The mean (SD) for the 36-item Short-Form Health Survey PCS for women whose PCS improved by at least 5 points (n = 265) and for women whose PCS did not improve (n = 1542) is shown. Error bars indicate the SD.

